| Titli lohar (M.Sc. Geoinformatics –III Sem) Sangam University Bhilwara (Rajasthan) | Dr. Lokesh Kumar Tripathi Professor & Head Dept. of Geoinformatics Sangam University, Bhilwara (Rajasthan) |
Abstract
The assessment of water quality is essential for ensuring safe and sustainable water resources, particularly in regions with diverse hydrological and land use patterns. This study evaluates the Ground water quality of Puruliya district, West Bengal, using the Water Quality Index (WQI) integrated with geospatial techniques. Water samples were collected from various locations and analyzed based on key physical-chemical parameters. The WQI values were computed to classify water into categories ranging from excellent to poor. GIS mapping was employed to visualize spatial variations in water quality across the district. The results indicate that while several areas fall under the ‘excellent’ and ‘good’ categories, certain pockets exhibit relatively lower water quality, possibly due to anthropogenic pressures and seasonal influences. The integration of WQI and GIS provides an effective framework for identifying pollution hotspots and guiding water resource management strategies in the region. This approach can be replicated for similar environmental assessments in other districts.
Keywords- Groundwater Quality, Water Quality Index (WQI), Puruliya District, WestBengal, Geographic Information System (GIS), Physico-chemical Parameters, Water Pollution, Rural Water Resources, Public Health Risk.
Introduction
Water is one of the most vital natural resources, playing a critical role in sustaining life, ecosystems, and socio-economic development. However, with growing population pressure, rapid urbanization, and industrial activities, ground water resources are increasingly being subjected to degradation in quality. Monitoring and assessing water quality has, therefore, become essential to ensure the sustainability of freshwater resources, particularly in rural and semi-urban districts like Puruliya in West Bengal, India.
The Water Quality Index (WQI) is a widely used tool to evaluate the overall quality of water by integrating various physical-chemical parameters into a single value that can be easily interpreted by policymakers, planners, and the public. WQI provides a holistic view of water health and helps categorize water bodies into ‘excellent,’ ‘good,’ ‘poor,’ or ‘unfit’ for use. When combined with geospatial technologies such as Geographic Information Systems (GIS), WQI mapping becomes a powerful tool to visualize spatial variations in water quality and identify critical zones that require attention.
Puruliya, located in the western part of West Bengal, is a region characterized by a hilly terrain, forest cover, and tribal population. Despite having natural streams and rivers, water accessibility and quality remain a challenge due to seasonal fluctuations, lack of treatment infrastructure, and localized pollution sources. Therefore, a comprehensive analysis of ground water quality in this region is essential.
This study aims to assess the ground water quality of Puruliya using the WQI method and visualize its spatial distribution through GIS mapping. By identifying patterns and pollution-prone zones, the research provides a scientific basis for local water resource planning, pollution control measures, and sustainable development efforts. The integration of field sampling, statistical analysis, and geospatial visualization in this study offers a robust framework for environmental monitoring and policy-making.
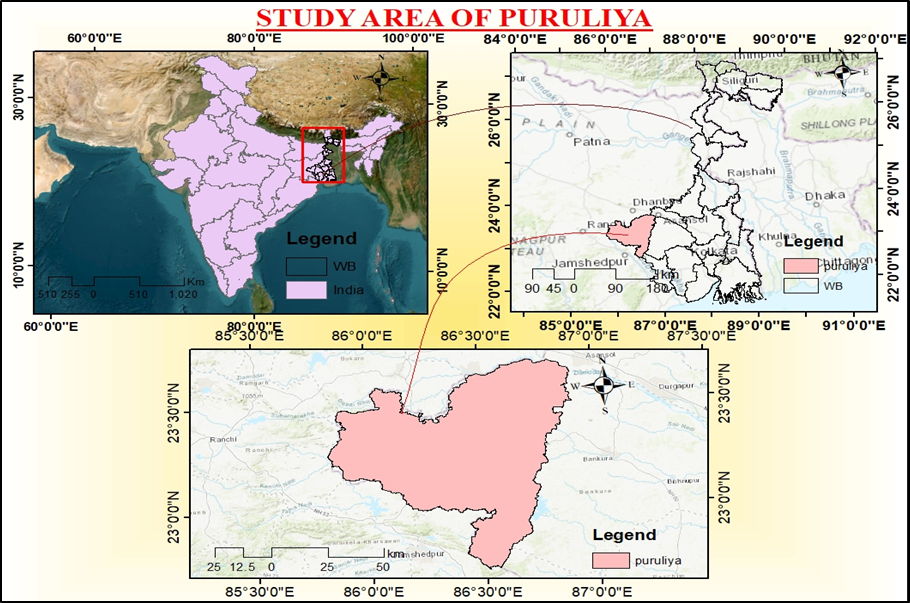
STUDY AREA
Puruliya district is located in the western part of West Bengal, India, between latitudes 22°42′ N to 23°42′ N and longitudes 85°49′ E to 86°54′ E. Covering an area of approximately 6,259 km², it forms part of the Chota Nagpur Plateau and is characterized by rugged topography, undulating terrain, scattered hills, and forested regions. The district shares its borders with Jharkhand to the west and south, and with the districts of Bankura, Paschim Medinipur and Bardhaman in West Bengal.
The region experiences a tropical climate with hot summers, moderate rainfall during the monsoon, and mild winters. The annual average rainfall ranges from 1100 mm to 1500 mm, predominantly received during the monsoon months (June to September). Rivers such as the Kangsabati, Subarnarekha, and Kumari, along with several seasonal streams and reservoirs, constitute the main surface water sources in the district.
Agriculture is the primary occupation in Puruliya, supported by surface water and limited groundwater resources. However, industrial activities, increasing population, and limited infrastructure for water treatment have led to growing concerns over the quality of water sources in the region. Additionally, the seasonal flow of streams and dependence on rain-fed systems make the district vulnerable to water scarcity and quality issues, especially during the dry season.
The district’s diverse hydro-ecological setting and dependence on natural water bodies make it a suitable region for evaluating water quality using spatial and statistical approaches. This study focuses on assessing the surface water quality of key rivers and streams across different blocks in Puruliya using WQI and GIS tools.
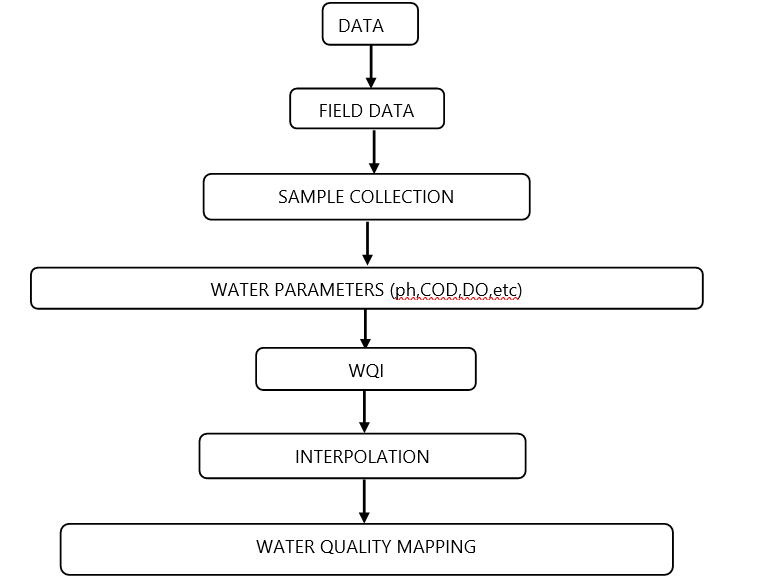
METHODOLOGY
ANALYSIS AND RESULT:
In this study involves a systematic approach combining field sampling, laboratory analysis, Water Quality Index (WQI) computation, and geospatial mapping to assess the ground water quality in Puruliya district.
1. Sample Collection and Location Selection
Water samples were collected from multiple predetermined locations across the Puruliya district, including streams, rivers, and reservoirs. Sampling sites were chosen based on stream order, human settlements, land use patterns, and accessibility. The spatial distribution of sampling points was mapped using GPS coordinates and integrated into a GIS environment for further analysis.
Water Quality Parameters-
- pH
- Electric Conductivity
- Total Dissolved Solids
- Total Alkalinity
- Chlorides
- Total Hardness
- Dissolved Oxygen
- Fluoride
- Calcium
- Magnesium
- Sulphate
- Nitrate
Selection of WQI Method:
Weighted Arithmetic Index method (Brown et al., 1972)
| SN | Parameters | Standard Permissible Value (Sn) | Recommended Agency |
| 1 | PH | 8.5 | ICMR/IBS |
| 2 | EC (μ-s/cm) | 300 | ICMR |
| 3 | TDS (mg/L) | 500 | ICMR / IBS |
| 4 | bicarbonate (mg/L) | 120 | ICMR |
| 5 | Chlorides (mg/L) | 250 | ICMR |
| 6 | Total Hardness (mg/L) | 300 | ICMR / IBS |
| 7 | DO (mg/L) | 5 | ICMR / IBS |
| 8 | Fluoride (mg/L) | 1.5 | IBS |
| 9 | Ca (mg/L) | 75 | ICMR / IBS |
| 10 | Mg (mg/L) | 30 | ICMR / IBS |
| 11 | Sulphate (mg/L) | 200 | ICMR / IBS |
| 12 | Sodium (mg/L) | 200 | ICMR/ IBS |
| 13 | Potassium (mg/L) | 12 | ICMR/ IBS |
The Canadian Council of Ministers of the Environment Water Quality Index (CCME WQI),National Sanitation Foundation Water Quality Index (NSF WQI) and many more.
Selected parameters must have standard limit prescribed by WHO/BIS/ICMR Calculation of parameters must have standard limit prescribed by WHO/BIS/ICMR. Calculation of unit weight (Wn) for various water quality parameters are inversely proportional to the recommended standards for the corresponding parameters. Wn = K/Sn
Where,
Wn = unit weight of nth parameters
Sn = standard value for nth parameters

Table 2 : calculation table of unit weight (Wn)
| SN | Parameters | Standard Permissible Value (Sn) | 1/Sn | ∑1/Sn | k=1/∑1/Sn | Wn= k/Sn |
| 1 | Potassium (mg/L) | 12 | 0.083333 | 0.931647 | 1.073368 | 0.089447 |
| 2 | Chloride (mg/L) | 250 | 0.004 | 0.931647 | 1.073368 | 0.004293 |
| 3 | Calcium (mg/L) | 75 | 0.013333 | 0.931647 | 1.073368 | 0.014312 |
| 4 | Bicarbonate (mg/L) | 200 | 0.005 | 0.931647 | 1.073368 | 0.005367 |
| 5 | Magnesium (mg/L) | 30 | 0.033333 | 0.931647 | 1.073368 | 0.035779 |
| 6 | Fluoride (mg/L) | 1.5 | 0.666667 | 0.931647 | 1.073368 | 0.715579 |
| 7 | Electrical Conductivity (µS/cm) at 25°C) | 300 | 0.003333 | 0.931647 | 1.073368 | 0.003578 |
| 8 | Sodium (mg/L) | 200 | 0.005 | 0.931647 | 1.073368 | 0.005367 |
| 9 | pH | 8.5 | 0.117647 | 0.931647 | 1.073368 | 0.126279 |
| ∑1/Sn=0.931647 | ∑Wn =1 |
Ideal value
All the ideal values (Vio) are taken as zero for drinking water except for pH=7.0, Dissolved Oxygen = 14.6 mg/L,
And Fluoride = 1 mg/L.
Calculation of Sub Index of Quality Rating (Qn)
Let there be n water quality parameters where the quality rating or sub index (Qn) corresponding to the nth parameter is a number reflecting the relative value of this parameter in the polluted water with respect to its standard permissible value. The value of qn is calculated using the following expression
Formula:
Qn = 100[(Vn-Vio)/(Sn-Vio)]
Where,
Qn = quality rating for the nth water quality parameter.
Vn = observed value of the nth parameter.
Sn = standard permissible value of nth parameter.
Vio = ideal value of nth parameter in pure water.
All the ideal values (Vio) are taken as zero for drinking water except for pH=7.0, Dissolved Oxygen = 14.6 mg/L, and Fluoride = 1 mg/L.
Calculation of Quality Rating for Ph:
For pH the ideal value is 7.0 (for natural water) and a permissible value is 8.5 (for polluted water). Therefore, the quality rating for pH is calculated from the following relation:
QpH = 100[(VpH-7.0)/(8.5-7.0)]
Where,
VpH = observed value of pH during the study period.
Calculation of Quality Rating for Dissolved Oxygen:
The ideal value (Vio) for dissolved oxygen is 14.6 mg/L and standard permitted value for drinking water is 5mg/L. Therefore, quality rating is calculated from following relation:
QDO = 100[(VDO – 14.6)/(5 – 14.6)]
Where,
VDO = observed value of dissolved oxygen
Calculation of Quality Rating for Fluoride:
The ideal value (Vio) for fluoride is 1 mg/L and standard permitted value for drinking water is 1.5 mg/L. Therefore, quality rating is calculated from following relation:
QF = 100[(VF – 1)/(1.5 – 1)]
where,
VF = observed value of fluoride.
Calculation of WQI :
WQI is calculated from the following equation
WQI = ∑ QnWn / ∑Wn
Table-3 shows the classification of water quality status based on Water Quality index (Ramakrishnaiah et al. 2009, Bhaven et al. 2011 and Srinivasa Kushtagi et. al. 2012,).
Table 3: Water Quality Classification Based on WQI Value
| Class | WQI value | Water Quality Status |
| 1 | <50 | Excellent |
| 2 | 50-100 | Good Water |
| 3 | 100-200 | Poor water |
| 4 | 200-300 | Very poor water |
| 5 | >300 | Water unsuitable for drinking |
| Station Name | Potassium (mg/L) | Chloride (mg/L) | Calcium (mg/L) | Bicarbonate (mg/L) | Magnesium (mg/L) | Fluoride (mg/L) | Electrical Conductivity (µS/cm) at 25°C) | Sodium (mg/L) | pH |
| Anara | 1.85 | 109.895 | 10 | 207.4 | 49.815 | 0.08 | 820 | 76.14 | 7.83 |
| Arsha | 15.98 | 77.99 | 16 | 219.6 | 36.45 | 0.31 | 576 | 43.28 | 8.07 |
| Baghmundi | 27.85 | 265.875 | 22 | 213.5 | 99.63 | 0.28 | 1386 | 88.65 | 7.85 |
| Balitora | 2.58 | 141.8 | 16 | 183 | 63.18 | 0.86 | 937 | 78.64 | 7.6 |
| Bamundiha | 1.64 | 49.63 | 22 | 115.9 | 12.15 | 0.08 | 311 | 28.96 | 7.84 |
| Barabazar | 65.06 | 311.96 | 58 | 402.6 | 95.985 | 0.34 | 1728 | 105.68 | 8.08 |
| Bero | 2.44 | 46.085 | 12 | 146.4 | 20.655 | 0.06 | 435 | 53.99 | 7.98 |
| Bishpuria | 2.13 | 265.875 | 16 | 170.8 | 108.135 | 0.19 | 1047 | 42.22 | 7.82 |
| Chakaltore | 1.81 | 81.535 | 16 | 152.5 | 40.095 | 0.68 | 542 | 35.74 | 7.98 |
| Deuli | 1.47 | 138.255 | 18 | 183 | 71.685 | 0.19 | 800 | 41.82 | 8.09 |
| Dhabani | 9.45 | 99.26 | 8 | 207.4 | 69.255 | 0.27 | 709 | 23.91 | 8.08 |
| Dhobakata | 3.11 | 191.43 | 30 | 280.6 | 61.965 | 0.38 | 1168 | 112 | 8.15 |
| Durgu | 4.52 | 280.055 | 14 | 134.2 | 98.415 | 0.16 | 1153 | 67.14 | 7.94 |
| Duriakata | 1.19 | 35.45 | 36 | 201.3 | 17.01 | 0.24 | 414 | 28.64 | 8.15 |
| Gobag | 36.35 | 85.08 | 22 | 115.9 | 21.87 | 0.17 | 645 | 50.3 | 7.81 |
| Hansla More | 1.78 | 21.27 | 14 | 128.1 | 17.01 | 0.64 | 260 | 12.03 | 8 |
| Imundi | 38.4 | 347.41 | 14 | 298.9 | 98.415 | 0.13 | 1560 | 132.7 | 7.95 |
| Indrabil | 7.22 | 145.345 | 20 | 573.4 | 115.425 | 0.16 | 1325 | 87.78 | 8.23 |
| Kantadihi | 7.63 | 556.565 | 60 | 213.5 | 173.745 | 0.1 | 1984 | 93.71 | 7.89 |
| Kashiberia | 11.44 | 173.705 | 66 | 353.8 | 68.04 | 0.41 | 1410 | 114.34 | 8.32 |
| Keshargarh | 14.93 | 251.695 | 14 | 359.9 | 120.285 | 0.16 | 1430 | 88.32 | 8.24 |
| Khariduyara | 2.82 | 124.075 | 16 | 256.2 | 49.815 | 0.36 | 758 | 71.78 | 8.2 |
| Korenge | 1.75 | 17.725 | 16 | 128.1 | 15.795 | 1.17 | 250 | 10.88 | 7.81 |
| Kotshila | 3.68 | 173.705 | 10 | 115.9 | 64.395 | 0.23 | 838 | 66.99 | 7.69 |
| Kulabahal | 38.7 | 138.255 | 22 | 195.2 | 40.095 | 0.26 | 967 | 85.32 | 8.13 |
| Kulgara | 0.95 | 10.635 | 14 | 79.3 | 4.86 | 0.18 | 155 | 12.82 | 7.77 |
| Kustar | 7.91 | 63.81 | 14 | 323.3 | 52.245 | 0.08 | 685 | 53.23 | 8.3 |
| Manbazar | 1.02 | 102.805 | 14 | 219.6 | 23.085 | 0.24 | 694 | 90.58 | 8.05 |
| Namsole | 1.56 | 28.36 | 24 | 122 | 13.365 | 0.37 | 286 | 14.98 | 7.94 |
| Napara | 12.88 | 113.44 | 14 | 195.2 | 63.18 | 0.12 | 863 | 49.47 | 7.74 |
| Nituria | 2.91 | 53.175 | 20 | 201.3 | 42.525 | 0.37 | 623 | 41.26 | 7.98 |
| Pandrama | 3.51 | 166.615 | 18 | 115.9 | 68.04 | 0.23 | 820 | 46.71 | 7.9 |
| Podalaroad | 8.02 | 414.765 | 70 | 201.3 | 134.865 | 0.73 | 2108 | 120.94 | 7.81 |
| Sankhari | 7.5 | 42.54 | 32.064 | 305.05 | 17.024 | 1.1 | 605 | 77 | 7.82 |
| Santuri | 4.08 | 56.72 | 22 | 115.9 | 26.73 | 0.24 | 375 | 14.52 | 7.9 |
| Sindurpur | 31.29 | 113.44 | 30 | 213.5 | 52.245 | 0.52 | 958 | 62.98 | 8.35 |
| Takariya | 15.05 | 95.715 | 12 | 164.7 | 41.31 | 0.64 | 701 | 62.44 | 7.86 |
| Tulin | 8.46 | 304.87 | 16 | 128.1 | 74.115 | 0.24 | 1221 | 122.41 | 7.88 |
Table 4: Calculation of Water Quality Index
| Anara station | ||||||||||
| Sl no. | Parameters | Standard Permissible Value (Sn) | 1/Sn | ∑1/Sn | k=1/∑1/Sn | Wn= k/Sn | Observed value(Vn) | IDEAL VALUE | qn | wn*qn |
| 1 | Potassium (mg/L) | 12 | 0.083333 | 0.931647 | 1.073368 | 0.089447 | 1.85 | 0 | 15.41666667 | 1.37898 |
| 2 | Chloride (mg/L) | 250 | 0.004 | 0.931647 | 1.073368 | 0.004293 | 109.895 | 0 | 43.958 | 0.188732 |
| 3 | Calcium (mg/L) | 75 | 0.013333 | 0.931647 | 1.073368 | 0.014312 | 10 | 0 | 13.33333333 | 0.190821 |
| Sl no. | Parameters | Standard Permissible Value (Sn) | 1/Sn | ∑1/Sn | k=1/∑1/Sn | Wn= k/Sn | Observed value(Vn) | IDEAL VALUE | qn | wn*qn |
| 4 | Bicarbonate (mg/L) | 200 | 0.005 | 0.931647 | 1.073368 | 0.005367 | 207.4 | 0 | 103.7 | 0.556541 |
| 5 | Magnesium (mg/L) | 30 | 0.033333 | 0.931647 | 1.073368 | 0.035779 | 49.815 | 0 | 166.05 | 5.941091 |
| 6 | Fluoride (mg/L) | 1.5 | 0.666667 | 0.931647 | 1.073368 | 0.715579 | 0.08 | 0 | 5.333333333 | 3.816419 |
| 7 | Electrical Conductivity (µS/cm) at 25°C) | 300 | 0.003333 | 0.931647 | 1.073368 | 0.003578 | 820 | 0 | 273.3333333 | 0.977957 |
| 8 | Sodium (mg/L) | 200 | 0.005 | 0.931647 | 1.073368 | 0.005367 | 76.14 | 0 | 38.07 | 0.204316 |
| 9 | pH | 8.5 | 0.117647 | 0.931647 | 1.073368 | 0.126279 | 7.83 | 7 | 55.33333333 | 6.987414 |
| 0.931647 | 1 | 20.24227 | ||||||||
| Water Quality Index = ∑ WnQn/∑Wn = 20.24227 | ||||||||||
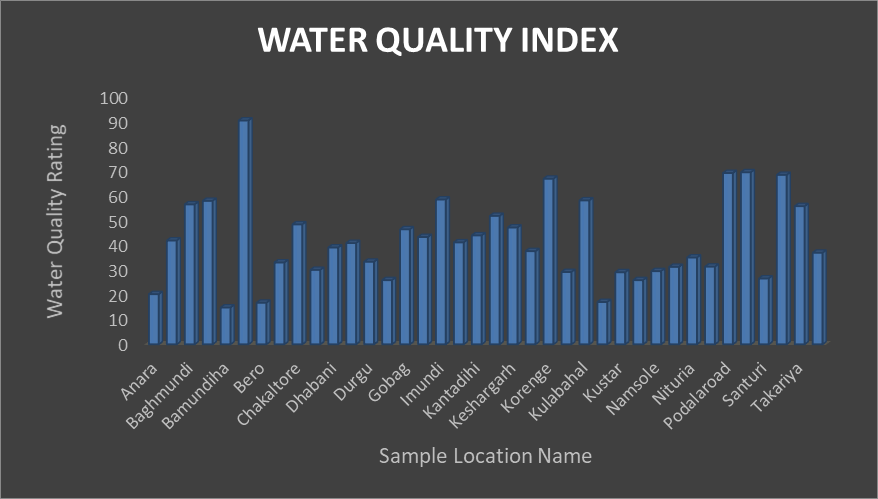
Table 5: Station wise Water Quality rating
| Station Name | Longitude | Latitude | WQI |
| Anara | 86.58 | 23.49 | 20.24227 |
| Arsha | 86.1625 | 23.33333 | 41.88666 |
| Baghmundi | 86.05 | 23.19167 | 56.49487 |
| Balitora | 86.875 | 23.58 | 57.90423 |
| Bamundiha | 86.3536 | 23.2386 | 14.82418 |
| Barabazar | 86.375 | 23.0041 | 90.32197 |
| Bero | 86.7625 | 23.50833 | 16.75931 |
| Bishpuria | 86.7375 | 23.2583 | 33.03366 |
| Chakaltore | 86.3625 | 232166 | 48.41765 |
| Deuli | 86.475 | 23.5375 | 30.02365 |
| Dhabani | 86.49 | 22.9 | 39.06542 |
| Dhobakata | 86.377 | 23.333 | 40.86539 |
| Durgu | 86.013 | 23.385 | 33.31625 |
| Duriakata | 86.689 | 23.298 | 25.90491 |
| Gobag | 86.775 | 23.6 | 46.41345 |
| Hansla More | 86.1717 | 23.3272 | 43.29518 |
| Imundi | 86.2753 | 23.3936 | 58.4422 |
| Indrabil | 86.7825 | 23.4113 | 41.12109 |
| Kantadihi | 86.308 | 23.1958 | 43.96309 |
| Kashiberia | 86.549 | 23.544 | 51.8092 |
| Keshargarh | 86.5625 | 23.254 | 47.1538 |
| Khariduyara | 86.63 | 22.9892 | 37.6218 |
| Korenge | 85.975 | 23.21667 | 66.82923 |
| Kotshila | 86.00833 | 23.45 | 29.18335 |
| Kulabahal | 86.542 | 23.303 | 58.10823 |
| Kulgara | 86.58 | 23.32 | 17.07445 |
| Kustar | 86.516 | 23.504 | 29.09161 |
| Manbazar | 86.654 | 23.06 | 25.90598 |
| Namsole | 86.246 | 23.131 | 29.5365 |
| Napara | 86.675 | 23.4 | 31.23786 |
| Nituria | 86.824 | 23.662 | 35.00876 |
| Pandrama | 86.3228 | 23.2664 | 31.32384 |
| Podalaroad | 86.4 | 23.35 | 69.13318 |
| Sankhari | 86.359 | 23.053 | 69.43143 |
| Santuri | 86.857 | 23.525 | 26.56951 |
| Sindurpur | 86.61 | 23.122 | 68.37782 |
| Takariya | 86.348 | 23.159 | 55.75518 |
| Tulin | 85.89444 | 23.35389 | 36.96014 |
CONCLUSION
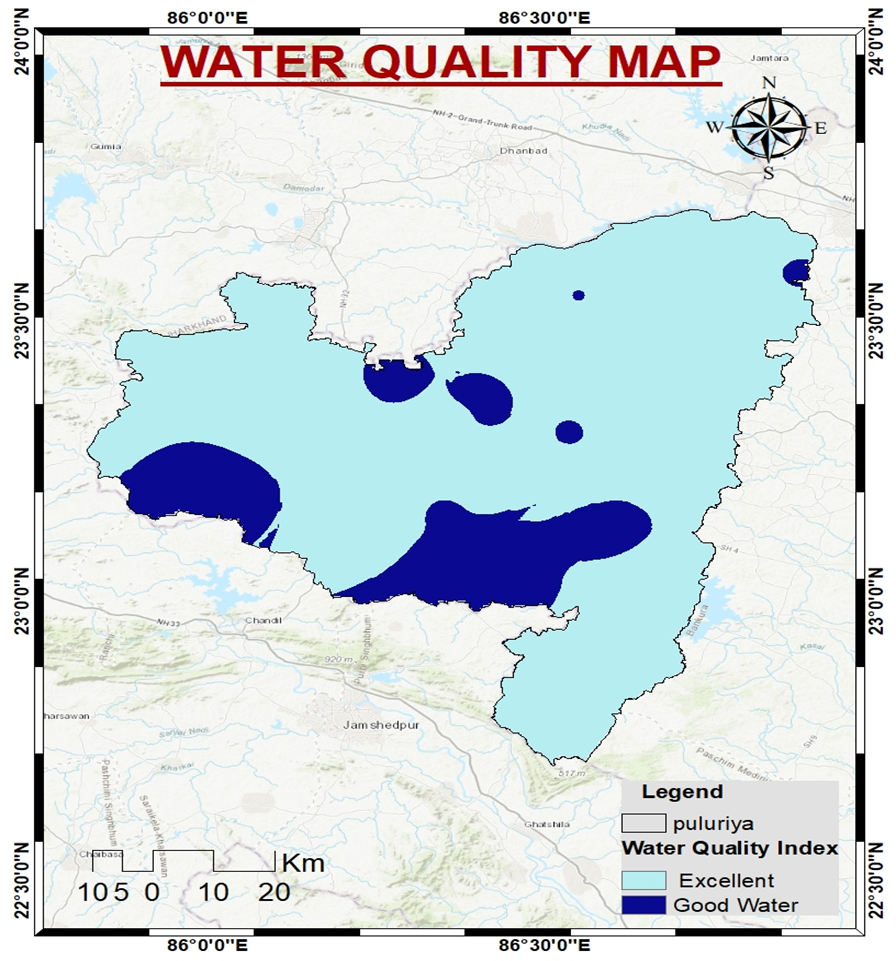
This study successfully assessed the ground water quality of Puruliya district, West Bengal, using the Water Quality Index (WQI) approach integrated with Geographic Information System (GIS) techniques. The analysis of physics-chemical parameters across various sampling sites revealed that most locations fall under the ‘Excellent’ and ‘Good’ categories, indicating overall favorable water conditions. However, certain pockets with ‘Moderate’ and ‘Poor’ WQI scores highlight emerging concerns due to anthropogenic activities, agricultural runoff, and inadequate sanitation.
The spatial distribution of WQI, visualized through GIS-based mapping, provided a clear understanding of pollution patterns and water quality gradients across different stream orders. This geospatial insight is valuable for identifying critical zones that require immediate intervention and sustainable management.
The study emphasizes the need for regular water quality monitoring, especially in ecologically sensitive and densely populated regions. By integrating scientific analysis with spatial tools, the research offers a replicable framework for water quality assessment and policy planning in similar geographic settings across India.
References
- Tiwari, T. N., & Mishra, M. A. (1985). A preliminary assignment of water quality index of major Indian rivers. Indian Journal of Environmental Protection, 5(4), 276–279.
- Yogendra, K., & Puttaiah, E. T. (2008).Determination of water quality index and suitability of an urban water body in Shimoga Town, Karnataka. Proceedings of Taal 2007: The 12th World Lake Conference, 342–346.
- Kumar, A., Biswas, A., & Das, S. (2021). Assessment of surface water quality using Water Quality Index (WQI) and GIS in Bankura District, West Bengal, India. Applied Water Science, 11, 129. https://doi.org/10.1007/s13201-021-01424-9
- Ramakrishnaiah, C. R., Sadashivaiah, C., & Ranganna, G. (2009). Assessment of Water Quality Index for the Groundwater in Tumkur Taluk, Karnataka State, India. E-Journal of Chemistry, 6(2), 523–530.
- Patra, P., Debanshi, S., & Roy, P. (2019). A GIS-based approach for assessing water quality index of surface water in Durgapur Industrial Region, West Bengal, India. Environmental Monitoring and Assessment.