| Prashant Dubey Asst. Prof. (Department of Geography) Govt. V.Y.T.P.G. Auto. College Durg | Dr. Amritesh Shukla Asst. Prof. (Department of Political Science) Indira Gandhi Govt. P.G. College Vishali Nagar, Bhilai, Durg |
Abstract
The decade 2001–2011 marked a significant phase of demographic and socio-economic transformation in Durg district, Chhattisgarh. The present study analyzes the major trends in population growth, urban expansion, industrial development, and associated social changes during this period. Using secondary data from Census of India (2001 and 2011) and district statistical records, the study employs descriptive statistical methods to assess changes in population density, literacy levels, migration patterns, and sectoral employment shifts. The findings reveal that rapid industrialization, particularly driven by the Bhilai Steel Plant and its allied industries, stimulated large-scale rural-to-urban migration and accelerated urbanization. Improvements in educational and health infrastructure contributed to positive social outcomes including a rise in literacy rates and a marginal improvement in the sex ratio. However, the surge in population also exerted pressure on urban infrastructure, public services, and environmental conditions, while rural-urban development disparities persisted. Overall, the decade reflects a transitional growth phase for Durg, emphasizing the need for balanced regional planning and sustainable development strategies to address future challenges.
Keywords: Durg district, population growth, urbanization, migration, socio-economic change, Chhattisgarh, 2001–2011
1. Introduction
During the first decade of the 21st century, India witnessed rapid growth in population, urbanization, globalization, and industrial transformation, which deeply influenced the nation’s social and economic structure (Bhagat, 2011). The expansion of employment
opportunities, improvement in health and education services, and development of transport infrastructure contributed to geographical redistribution of population. Rising rural-to-urban migration resulted in a fast expansion of major and medium-sized cities, leading to significant changes in population density and settlement patterns.
In this context, Durg district of Chhattisgarh experienced notable demographic
and socio-economic shifts during 2001–2011. The presence of the Bhilai Steel Plant and the expansion of its allied industries played a crucial role in shaping the district as an important industrial center. Consequently, employment generation, commercial activities, and the growth of the service sector increased substantially in urban locations (Sharma & Yadav, 2013). Simultaneously, improved educational facilities, healthcare expansion, and enhanced urban services positively influenced human development indicators in the region.
However, the pace of population growth also generated pressure on infrastructure, housing, drinking water supply, transportation, and environmental resources. Challenges such as the rise of informal settlements, industrial pollution, and persistent rural–urban disparities also emerged. These conditions highlighted the need for sustainable and balanced regional development planning in the district.
Considering this background, the present study aims to examine the trends in population growth, understand the nature of urbanization, identify the determinants of migration and socio-economic changes, and evaluate their developmental implications in Durg district during the decade 2001–2011. The study not only reveals the actual status of regional development but also provides meaningful insights for future policy formulation.
2. Profile of Durg District
Durg district is located in the central Indian state of Chhattisgarh, forming an important part of the state’s socio-economic landscape. The district is situated on the fertile plains of Chhattisgarh and is bounded by Bemetara district in the north, Rajnandgaon district in the west, Balod district in the south and Raipur district in the east. The district headquarters is the city of Durg, which along with Bhilai forms a major urban cluster known for its industrial and educational significance. (Durg District, Chhattisgarh+1)
Geographically, Durg lies between 20°54′ and 21°32′ North latitude and81°10′ and 81°36′ East longitude, covering an area of approximately 2238.36 square kilometres. The district is positioned at an average elevation of about 317 meters above mean sea level and is drained by the Shivnath (Sheonath) River, a tributary of the Mahanadi. (Durg District, Chhattisgarh+1)
The city of Durg itself is located at approximately 21.19° N latitude and 81.28° E longitude, forming part of the larger Durg-Bhilai urban agglomeration. (Latitude)
Durg’s geographical location, with its well-connected rail and road networks – including the Howrah-Mumbai main railway line and major highways – has played a key role in fostering industrial growth and urban expansion. The presence of mineral resources, rich agricultural plains, and its central position within the state have further contributed to its emergence as an industrial and educational hub.
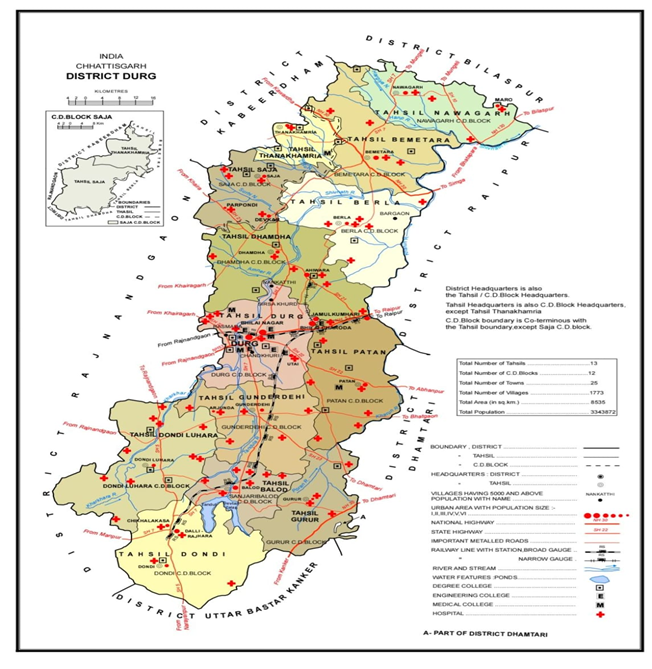
Diagram no. – 1: durg district map
source : census of india. 2011. district census handbook: durg, chhattisgarh
3. Objectives of the Study
- To analyze the trends of population growth and spatial distribution changes in Durg district during the decade 2001–2011.
- To examine the intensity of urbanization, its major driving factors, and its impact on the urban structure of the district.
- To assess the changes in key social indicators such as education and literacy during this period.
- To analyze the impact of industrial development and migration on the socio-economic structure and employment opportunities in the district.
4. Study Methodology
The present research adopts a descriptive and comparative research design based primarily on secondary data sources. The demographic and socio-economic data required for the study were collected from the Census of India (2001 and 2011), District Statistical Handbook, Economic Survey reports, and other government publications.
The collected data were analyzed using:
- Percentage change analysis
- Analysis of population density and growth rate
- Urbanization and migration analysis
- Comparative evaluation between 2001 and 2011
- Presentation through tables and graphical tools
The study area covers Durg district, including both urban and rural regions. The methodology focuses on assessing the demographic growth and socio-economic transformation during the decade, and identifying development trends and emerging challenges.
5. Data Analysis & Interpretation
The present chapter examines the major demographic changes in Durg district during the decade 2001–2011 on the basis of census indicators such as population growth, urban–rural distribution, sex ratio, literacy pattern and child population. The analysis highlights the pace and direction of socio-economic transformation in the district.
Table no. – 1: demographic indicators of durg district (2001–2011)
source : Census of India. (2001 and 2011). district census handbook: durg, chhattisgarh
| Indicators | 2001 | 2011 | Percentage decadal variation (2001–2011) | ||||||
| Urban | Rural | Total | Urban | Rural | Total | Urban (%) | Rural (%) | Total (%) | |
| Total Population | 1072309 | 1738127 | 2810436 | 1284765 | 2059107 | 3343872 | 19.8 | 18.5 | 19 |
| Female Population | 516374 | 876169 | 1,392,543 | 628816 | 1032955 | 1661771 | 21.8 | 17.9 | 19.3 |
| Sex Ratio (Females/1000 males) | 929 | 1016 | 982 | 988 | 1007 | 959 | +6.4 | -0.9 | -2.3 |
| Total Literacy Rate (%) | 82.3% | 71.3% | 75.6% | 85.59% | 74.88% | 79.06% | 4.0 | 5.0 | 4.6 |
| Male Literacy Rate (%) | 90.5% | 83.7% | 86.4% | 91.79% | 85.21% | 87.82% | 1.4 | 1.8 | 1.6 |
| Female Literacy Rate (%) | 73.5%% | 59.3% | 64.6% | 79.13% | 64.68% | 70.23% | 7.7 | 9.1 | 8.7 |
| Child Population (0–6 yrs) | 146795 | 291348 | 438143 | 147707 | 282829 | 430,536 | 0.6 | -2.9 | -1.7 |
| Child Sex Ratio(Females/1000 males) | 940 | 979 | 966 | 945 | 973 | 963 | 0.5 | -0.6 | -0.3 |
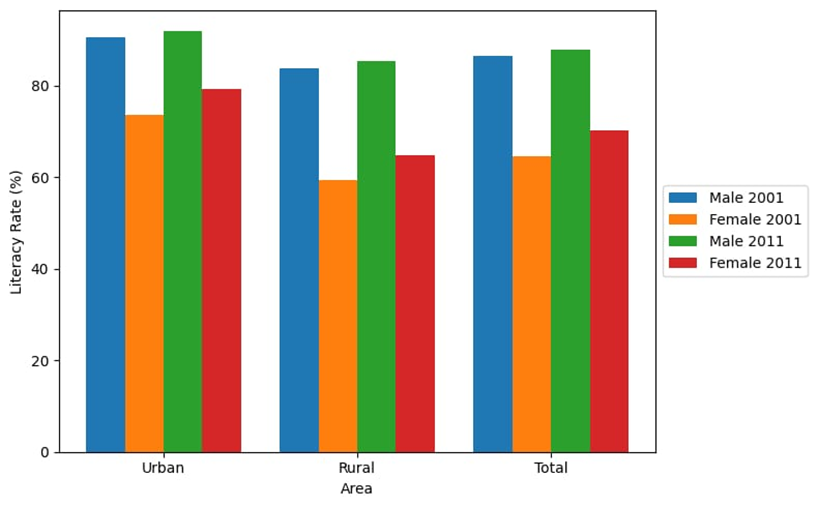
diagram no. – 2 : graphical representation of literacy in durg district (2001-2011)
5.1 Population Growth Pattern
According to census data, the total population of Durg district increased from 2,810,436 in 2001 to 3,343,872 in 2011, registering a decadal growth of approximately 19 percent. The annual average growth rate (AAGR) during the decade remained around 1.75 percent per year, indicating moderate but consistent population expansion.
Urban population recorded a slightly higher growth rate (19.8%) compared to rural population (18.5%), reflecting the growing importance of urban centres. Industrial development, employment opportunities and improved civic amenities, particularly in Bhilai and adjoining areas, have played a significant role in attracting population towards urban localities.
5.2 Urban–Rural Population Distribution
In 2001, urban population constituted nearly 38.2 percent of the total population of the district, which marginally increased to 38.4 percent in 2011. Although the proportional change appears limited, it indicates a steady trend of rural-to-urban migration.
The stability in proportion suggests that while urban areas are expanding, rural regions are also experiencing population growth, thereby maintaining overall balance. However, concentration of economic activities in industrial towns continues to strengthen the process of urbanization.
5.3 Female Population and Sex Ratio
Female population in Durg district increased from 1,392,543 in 2001 to 1,661,771 in 2011, showing a growth of about 19.3 percent, which is almost equivalent to total population growth. Urban areas registered comparatively higher female population growth (around 22%), suggesting better health facilities, education and employment opportunities for women in towns.
Despite this, the overall sex ratio declined from 982 females per 1000 males in 2001 to 959 in 2011, which is a matter of serious concern. Interestingly, urban sex ratio showed improvement, whereas rural areas experienced a decline, indicating that traditional socio-cultural preferences and limited healthcare access still influence demographic behaviour in rural regions.
5.4 Literacy Trends
Literacy levels in Durg district improved significantly during the decade. Total literacy rate increased from 75.6 percent in 2001 to 79.06 percent in 2011. Rural literacy improved by 3.58 percentage points, which is nearly equal to the improvement observed in urban areas.
This trend reflects the impact of educational policies, expansion of schooling infrastructure and awareness programmes aimed at increasing enrolment, particularly in rural areas. However, the urban–rural literacy gap still persists, indicating unequal access to quality education.
5.5 Male and Female Literacy Gap
A notable feature of literacy development in the district is the substantial rise in female literacy. Male literacy increased marginally from 86.4 percent to 87.82 percent, whereas female literacyrose from64.6 percent to 70.23 percent during the decade.
Consequently, the gender gap in literacy declined from 21.8 percentage points in 2001 to 17.6 percentage points in 2011, reflecting positive outcomes of women-centric education programmes and social awareness campaigns. Nevertheless, the existing gap indicates the need for continued policy focus on female education, especially in rural and economically weaker sections.
5.6 Child Population (0–6 Years)
The child population of the district declined from 438,143 in 2001 to 430,536 in 2011, registering a negative growth of about–1.7 percent. Moreover, the proportion of child population to total population decreased from 15.6 percent to 12.9 percent during the decade.
This decline suggests a reduction in fertility rates and reflects the increasing acceptance of family planning measures, improved healthcare services and changing socio-economic aspirations among families.
5.7 Child Sex Ratio
The child sex ratio declined marginally from 966 in 2001 to 963 in 2011. Rural areas experienced a greater decline, whereas urban areas showed slight improvement.
This pattern indicates that gender-biased practices and social attitudes towards girl children still persist, particularly in rural communities, despite legal safeguards and awareness programmes. The declining child sex ratio remains one of the most critical demographic challenges for sustainable social development.
5.8 Overall Assessment
Overall, the demographic transition in Durg district during 2001–2011 reflects a phase of moderate population growth, gradual urbanization and significant improvement in literacy, particularly among females. The reduction in child population indicates progress towards population stabilization, while the narrowing gender gap in literacy represents positive social change.
However, declining sex ratio and persistent urban–rural disparities highlight structural socio-economic inequalities that require focused policy interventions. Sustainable development in the district therefore depends not only on economic growth but also on strengthening social equity, healthcare access and gender-sensitive educational strategies.
6. Effects of Demographic Changes in Durg District (2001–2011)
Demographic changes in Durg district between 2001 and 2011 have created notable socio-economic and environmental impacts. These effects can be examined through the following major dimensions:
6.1 Effects of Population Growth
- Increased pressure on land, water, healthcare, transportation, and housing facilities.
- Expansion of slums and congested urban settlements.
- Rising unemployment and competition in local job markets.
- Growth in pollution levels and waste management challenges.
- Increased cost of living and demand for public services.
6.2 Effects of Literacy Improvement
- Greater social awareness and participation in developmental activities.
- Enhancement in women’s empowerment and reduction in gender inequality.
- Improvement in health practices, sanitation, and family planning awareness.
- Rise in demand for technical education and skilled employment sectors.
- Formation of a more modern and knowledge-based society.
6.3 Effects of Declining Child Population
- Indication of reduced birth rate due to urban lifestyle and education.
- Risk of future labor-force shortages if the trend continues.
- Persistent imbalance in child sex ratio reflecting social preference issues.
- Need for stronger policies on child care, nutrition, and gender equality.
6.4 Effects of Urbanization
- Better industrial and service-sector opportunities boosting economic growth.
- Rural-to-urban migration leading to uneven population distribution.
- Loss of agricultural land and green cover due to expanding infrastructure.
- Deterioration of air quality and increase in vehicle congestion.
- Shift in cultural patterns and modernization in lifestyle.
6.5 Effects on Employment Structure
- Growth of industrial employment especially around Bhilai–Durg corridor.
- Decline in dependence on agriculture as a primary occupation.
- Rise of small-scale industries, retail, and private sector jobs.
- Skill shortages in some technical fields due to changing economic demands.
6.6 Effects on Social Structure
- Improvement in living standards and access to modern services.
- Greater social mobility due to education and employment growth.
- Increased heterogeneity in urban population due to migration.
- Changes in traditional family structures and value systems.
The demographic changes have brought developmental opportunitiesas well as critical challenges. Balanced urban planning, gender equality measures, and sustainable development strategies are necessary to manage future population dynamics in the district.
7. Effects of Demographic Changes in Durg District
The decade 2001–2011 brought significant demographic transformations in Durg district, which had a wide range of socio-economic effects. The major observed impacts are as follows:
7.1 Effects of Rapid Population Growth
- Increased pressure on land, housing, and basic infrastructure
- Rise in demand for water, electricity, and transport services
- Expansion of urban boundaries and conversion of rural land into residential and industrial zones
7.2 Urbanization and Infrastructure Stress
- Growth of slums and informal settlements due to increased migration
- Overburdened drainage, sanitation, and waste-management systems
- Increased vehicular traffic leading to congestion and pollution
- Unequal access to urban services among different socio-economic groups
7.3 Changes in Educational and Social Indicators
- Improved literacy levels contributed to social awareness and changing lifestyles
- Reduction in gender disparity in education but still visible in rural areas
- Emerging demand for higher education and technical skills
7.4 Industrial Growth and Employment Shifts
- Manufacturing and service sectors became major employment providers
- Occupational shift from agriculture to industry and services
- Increased household income and improvement in standard of living
- However, industrial areas faced issues of pollution and worker safety
7.5 Migration and Social Dynamics
- Large-scale in-migration due to industrial employment opportunities
- Increased cultural diversity but also pressure on social harmony
- Rising dependency on rented housing and public amenities
7.6 Rural–Urban Disparity
- Rural areas remained dependent on agriculture with low income growth
- Limited healthcare and educational facilities in remote villages
- Slow pace of rural development in comparison to urban regions
7.7 Environmental Impacts
- Air and water pollution near industrial clusters
- Decreasing green cover and stress on natural resources
- Land degradation due to rapid construction and industrial waste
“Demographic transformation in Durg district has created strong growth opportunities, but has also intensified spatial inequality, environmental stress, and infrastructural burden.”
8. Conclusion
On the basis of the present study, it can be concluded that significant changes occurred in the demographic structure of Durg district during the decade 2001–2011, which clearly reflect the direction of socio-economic development of the district. During this period, the total population increased by about 19 percent, resulting in increased demand for employment, housing, transportation and urban amenities. Industrial development, particularly in the Bhilai industrial region, accelerated urban population growth and encouraged rural-to-urban migration.
The study also reveals a considerable improvement in literacy levels, especially in female literacy, which led to a reduction in the male–female literacy gap. This improvement indicates the positive impact of government योजनाएँ (schemes) and social awareness programmes promoting female education. The rise in rural literacy further suggests that the spread of education is no longer confined to urban areas alone.
A decline in the proportion of child population indicates a reduction in fertility rates and growing acceptance of family planning measures. This trend can be considered a positive sign towards long-term population stabilization. However, the decline in both overall sex ratio and child sex ratio reflects persistent social imbalance, suggesting that greater efforts are still required to achieve gender equality, particularly in rural areas.
Urbanization in the district has progressed gradually, but urban–rural disparities continue to exist in terms of access to education, healthcare and employment opportunities. Therefore, future development policies must prioritize regional balance, women empowerment, expansion of healthcare services and improvement in the quality of education.
In conclusion, Durg district has achieved notable social and educational progress during 2001–2011; however, focused and well-planned interventions are essential to address demographic challenges, especially declining sex ratio and rural backwardness, in order to ensure sustainable and inclusive development.
References
- Béteille, A. (2002). Social inequality. Oxford University Press.
- Bhende, A. A., & Kanitkar, T. (2010). Principles of population studies (4th ed.). Himalaya Publishing.
- Chandna, R. C. (2009). Geography of population. Kalyani Publishers.
- Census of India. (2001). District census handbook: Durg, Chhattisgarh. Office of the Registrar General & Census Commissioner, Government of India.
- Census of India. (2011). District census handbook: Durg, Chhattisgarh. Office of the Registrar General & Census Commissioner, Government of India.
- Dandekar, V. M., & Rath, N. (2003). Poverty in India. Indian School of Political Economy.
- Government of Chhattisgarh. (2010). District human development report: Durg. Directorate of Economics and Statistics, Government of Chhattisgarh.
- Kumar, S., & Ali, S. (2012). Urban growth and socioeconomic change in Indian cities. Indian Journal of Regional Science, 44(2), 34–47.
- Mishra, R. P. (2007). Population studies and regional planning. Concept Publishing Company.
- Nayak, P. (2011). Economic transformation in developing regions: Trends and perspectives. Journal of Social and Economic Studies, 23(3), 71–86.
- Patel, A., & Tiwari, P. (2013). Changing demographic patterns and urban development in central India. International Journal of Social Sciences, 5(1), 55–68.
- Planning Commission of India. (2011). Poverty estimates for 2004–05 and 2009–10. Government of India.
- Rao, M. S. A. (2005). Urbanization and social change in India. Sociological Bulletin, 54(3), 402–420.
- Sharma, K. L. (2010). Social stratification and inequality in India. Rawat Publications.
- Singh, R. B. (2009). India’s urban development: Challenges and opportunities. Rawat Publications.
- United Nations. (2010). World urbanization prospects 2009 revision. United Nations Department of Economic and Social Affairs.
- Verma, R. (2012). Regional disparities and developmental issues in Chhattisgarh. Journal of Development Research, 5(2), 48–60.