| Mr. Ashley Fernandes Research Scholar Dept. of Geography University of Mumbai Mumbai (Maharashtra) India | Prof. Dr. Moushumi Datta Principal Nagindas Khandwala Mumbai (Maharashtra) India |
Abstract
Mumbai, the financial capital of India, experiences severe traffic congestion due to rapid urbanization, population growth, and increasing vehicular movement. This congestion has led to serious environmental problems such as air pollution and noise pollution, which directly affect individuals working near major roads, especially shopkeepers and hawkers. The present study aims to analyze the health problems experienced by shopkeepers and hawkers due to traffic congestion in the R/S ward of Greater Mumbai, covering areas such as Kandivali, Dahanukar Wadi, Charkop Sector 1 and 2, and Akurli.
The study is based on primary data collected through a structured questionnaire from shopkeepers and hawkers using random sampling technique. Secondary data were collected from various research papers, reports, and articles. Descriptive and analytical methods were adopted, and tools such as IBM SPSS and QGIS were used for data analysis and mapping.
The findings reveal that a significant proportion (86.7%) of respondents suffer from health issues such as respiratory problems, headaches, sensory organ irritation, infections, and hearing loss due to traffic-related air and noise pollution. The hypothesis testing confirms that the majority of shopkeepers and hawkers are adversely affected by traffic pollution. The study also highlights issues of harassment by municipal authorities, particularly among informal shop operators.
The study concludes that traffic congestion in urban areas has serious implications for both physical and mental health of workers located near busy roads. It emphasizes the need for better traffic management, promotion of electric vehicles, enforcement of no-honking zones, development of green buffers,
and protection of hawkers’ rights through policy intervention.
Keywords: Traffic Congestion, Shopkeepers and Hawkers, Air Pollution, Noise Pollution, Health Problems, Urban Environment, Occupational Health, Greater Mumbai, Vehicular Emission, Municipal Harassment
Introduction
The study shows that Mumbai is a financial capital of India and known as metropolitan city. In Mumbai many migrants come for their educational purpose, business activities, better living standards and main reason is that, they came for earning purpose. In one city people get all the facilities under one roof city. Shops and hawkers’ sale their goods to people. they have small shops and stalls nearby main road so people can see and buy their goods. The R/S ward have included some parts like Kandivali, Dahanukar Wadi, Akurli, Charkop sector 1 and 2. in these areas may found some traffic spots,the main road has lots of traffic mostly in peak-time from that traffic area as per shopkeepers said congestion cause lots of noise pollution, air pollution and it may affect people’s health such as breathing problem, organ issues, hearing loss some people found infections. It’s not contributed to the air that we breath but also takes toll on our mental wellbeing. Shopkeepers found trouble to face this all issues due to congestion of the traffic areas. The data collected from the shopkeepers and hawkers that found some people are facing the health issues and have negative impact from that pollution, which may raises harmful gases such as carbon dioxide (Co2), carbon monoxide (CO), nitrogen oxide (NOx) and sulphurdioxide (SO2) as well as other emissions of gases releases from the vehicles due traffic congestion and some having long time impact and they get months to recover from it.
Review of literature:
(Banerjee, 2012) in this research paper marked that rapid growth of urbanization in India causes pollution. Majorly found in air, noise pollution raises due to traffic congestion. Road traffic is a significant part of the urban environment and affects the people’s health. Such as breathing related problems found in the people who living in the urban areas. the growing numbers of vehicles can cause noise pollution and through these certain short-term and long-term dieses raises. Noise pollution causes sleep disturbances; hearing loss found in long-term impact of the traffic in urban areas.(Mullur, 2020) in her research paper “Impact of automobile emission on pulmonary function parameters of non-smoking road side venders and shopkeepers” suggests that the smoke that emilites from the vehicles due to traffic may affects badly to venders than the cigarette smoke. Due to congestion vehicles releases more harmful gases than the cigarette releases. Also, vehicular traffic is more in urban areas. pollution is an occupational health hazard to the people who work nearby traffic areas.(Huong, 2020) in her research paper “Health impact on traffic related air pollution” suggests that due to traffic air pollution raises and negatively impact to the living organisms. In her paper more focused on shopkeepers and hawkers who are highly and easily affected due to vehicle pollution. The harmful gages that emitted from the vehicles such as Particulate matter (PM), Ozon(O3), Nitrogen Dioxide (NO2) are considered most harmful traps to human health. The long-term exposure to these gases can lead to death around 4.2 million deaths can occur worldwide through these gases. Diesel and petrol vehicles are the main cause to raises the greenhouse gas emission.(Kumar, 2021) in his research paper “study on road traffic congestion” he suggests that, in Mumbai traffic areas are mostly found everywhere due to traffic congestion lot of harmful gases emission occur from vehicles and the shops are nearby o this traffic area gets affected as per early bases.And the shopkeepers, hawkers found negative impact on their health such as breathing problem are common issue found in every second person. Also, asthma, organ irritation found in shopkeepers but more in hawkers. Because shops have doors and hawkers only have stalls compare to shopkeepers they affected more.(Arregi, 2024) in her research paper “Road traffic noise exposure and its impact on health” the noise raises from the vehicles in the traffic areas and traffic spots can cause very bad impact to the people. specially the shopkeepers and hawkers they may face problems such as hearing loss, asthma due to congestion. The loud noise and smoke that raises from the vehicles may include harmful gases and long and repeatable sound at high level of decibels can cause low hearing capacity and some may find hearing loss. This mostly found in hawkers and shopkeepers compare to other people.
Research Objectives:
- To analyse the health problemsexperienced by shopkeepers and hawkers due to traffic congestion.
- To suggest the policy measures to reduce the pollution due to traffic congestion.
Hypothesis:
H1: Majority of respondents experience health problems due to traffic pollution
H10: Majority of respondents do not experience health problems due to traffic pollution
Research Methodology:
- Coverage
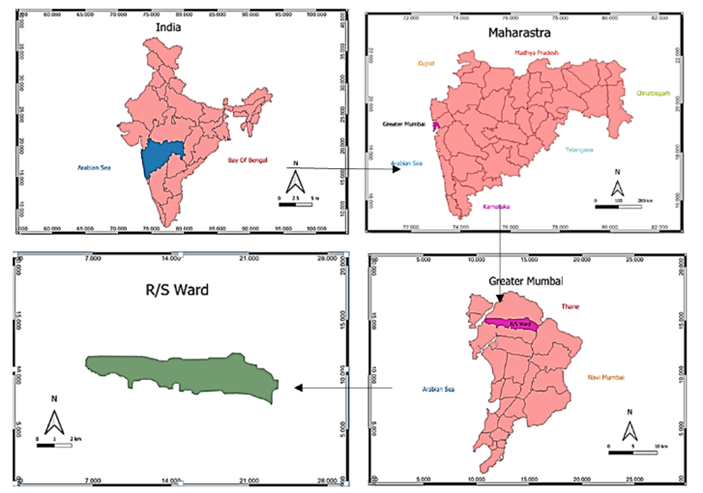
The ward selected for the study is R/S ward of Greater Mumbai. It includes areas like Kandivali, Dahanukar wadi, Charkop sector 1 and 2, and Akurli. It is one of the most populated, congested and polluted wards of the city. The latitudinal extension of the ward is from 19.20° N to 19.22° N and longitudinal extension is from 72.83° E to72.88° Eapproximately.
- Data Collection and Analysis
The review of literature has been compiled from published secondary data such as published research papers, articles to study about it more briefly.The primary data is collected with the help of a structured questionnaire to understand the various types of health issues faced by the shopkeepers and hawkers due to pollution caused by traffic congestion. The study follows descriptive and analytical research design. Random sampling method is used to collect data from different people in the different areas; both formal and informal shopkeepers are involved in this study. IBM SPSS and QGIS have been used to test the hypothesis and prepare the location map respectively.
Data Analysis and Discussion:
The collected data from shopkeepers and hawkers from R/S ward of Mumbai has shown some major problems faced by shopkeepers and hawkers such as respiratory, hearing problems, breathing problem and their period to get recover from it all are representing through charts and graphs.
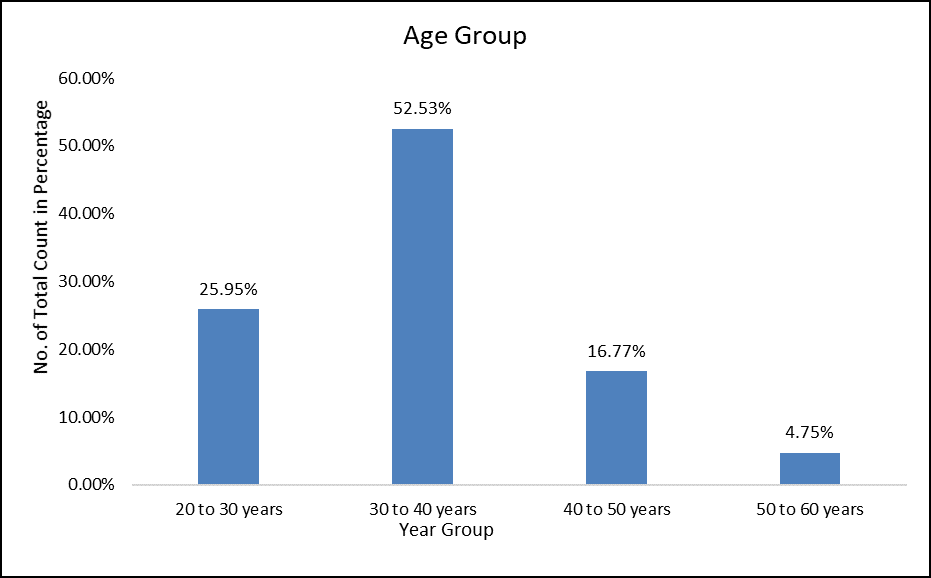
Fig No. 1.2
The bar graph represents the age group of the shopkeepers and hawkers. The highest category of the age group is between 30 to 40 years category people. because at this age people completed theirstudies and also well settled in their career that’s why this category of people is more actively passionate towards their work. After that next category is 20 to 30 years age group of people. this category of people tries to settled down in their career they are younger individuals who shaped themselves towards their career. Such as startup plans, handling family business that’s why it’s a second largest category of age group compare to other categories. Next category is 40 to 50 years age group people. in this category the total percentage of people decline because of their age, there physical ability towards the work. Also, they gave their business and work handover to their children’s and family members to handle that’s why at this category of 40 to 50 year gets decline. Last category is 50 to 60 years age group category of people it’s the age of their retirement period. Because mentally and physically exhausted since they work from their 20’s till 50-60 means almost 50 years of their life their working and built-up their own career. And now the age to get some rest from the work to look toward the family. Also, they also physically get week because of from the diseases they facedthat’s why at this age people not working.
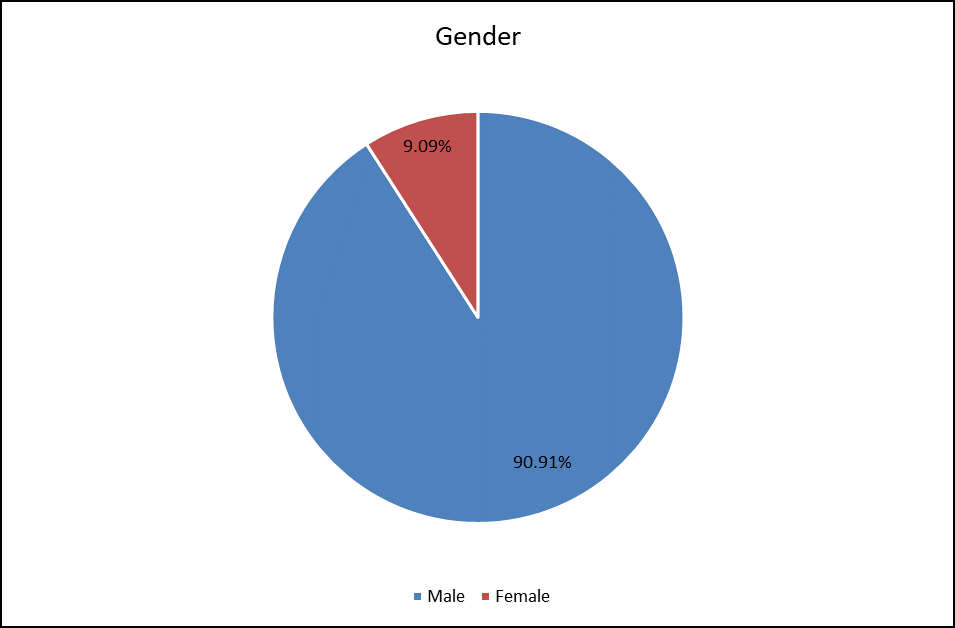
Fig No. 1.3
This upper pie charts shows the gender distribution of male and female. This indicates that majority of the male population compare to female and its shows gender imbalance among the both genders probably due to patriarchy male population mostly owned their own shops but there are some 9.09% of females handling their business they owned the shop because now a days women are also actively participated in their business. So, this pie chart shows that women also handled business in the year of 2025. This improvement was shown that in the upcoming years more womenactivelyparticipated and handling their business. If we see past decades majority women not activity involved in the business but now a days, we see that women can handled their own business and shops. To get gender equality in all work in terms of gender. But in the case of gender there are one more category is transgender people in this collected data does not show any transgender category people still in this 21st century they didn’t get involved in business also the reason is that they may didn’t know about their rights because The Transgender Persons (Protection Of Rights Act of 2019) they have Right to education, Right to employment also many more right that Government of India giving them to also the part of gender equality still they didn’t participated in business because of they may have fear that society does not accept that they are working and having their own business.
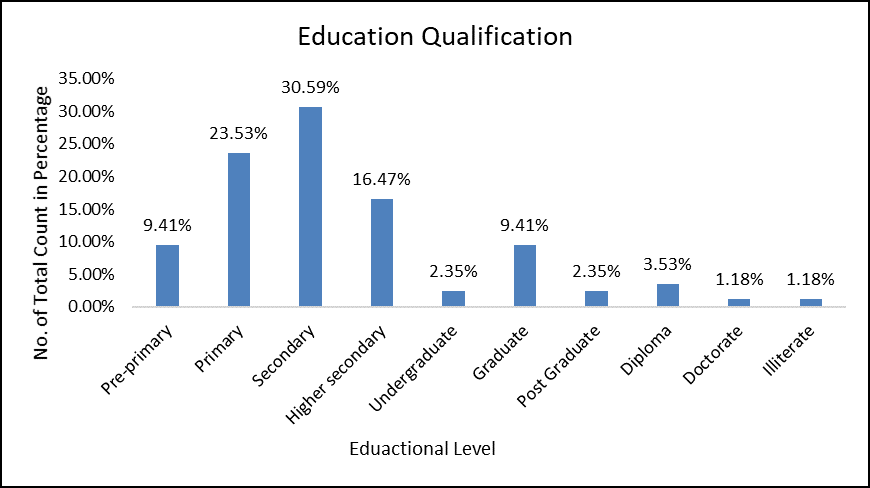
Fig No. 1.4
In this upper bar graph, it represents the education qualification of shopkeepers and hawkers. In the R/S ward of Mumbai. The first category is pre-primary education qualification category people. they studied till primary because at their time the importance of the education was not that much as compare to now a day. So, they just studied till primary and open their shops and stall for earning purpose. Another possible reason is family responsibility so they studied and learn from their family members about how to earn in the shop and stalls. The next category of people is the primary education category people. they studied till their fourthand fifth class and gets involved in their family business this category is the second highest category of people of education qualification of people.The highest category of percentage is the secondary education qualification people. which was 30.59% compare to other category of people. it indicates that the people who owned their shops and stall they are studied till secondary due at their time family business such as shops are more important to handle so, after their completing their secondary education, they involved in their family business to handle shop also other reason is that they want to study till their secondary and at very young age they want to handled it. And it’s good that more people give an importance to their education first. The other category is Higher secondary education qualification of people. it’s a third largest category of people after secondary and primary. 16.47% of people completed their education till 12th standard. And they involved in their business and also, they open their shops and stalls by own because they get legal licence after their eighteen years of age. So, they studied till 12th standard quickly involved in bossiness for improving and earning purpose. Next is the undergraduate category of people same percentage of people as the post graduates which was only 2.35% of people it’s a very less number because after people gets literate means they are capable of reading and writing and till they gets legal right to handled their shop they not showing much interest in their studies and want to open start-ups by their own that’s this both category of people are less because only few of them taking knowledge and studied to gets more information to improved their business. Graduate category of people having 9.41% of people. which was forth highest category of people in terms of education qualification same percentage as primary category. Most of the people are more aware about importance of education and they want to learn more about their bossiness and they gave first importance to their education by that time they involved in start-ups and side by side there education as well because people know that more education leads better employment opportunities that why this category of people having moderate level of percentage among the other category. Diploma category of people having 3.53% of people that shown people much interested in studies as well as their passion of having their own business and also the possible reason is that they want to gets more information for having multitask aspects towards their career. Last but not the least category of doctorate and illiterate peoplemost of people do doctorate and then the enter in the business after their career like teaching and other they done and also, they studied till doctorate and as they passionate to open their own business they open after their completing there PhD. And in the case of illiterate people because of their family shops are there so they didn’t give much important to the education to learn and then enter in businessas they grown up, they handled their family business such as shop and stalls open by themselves.
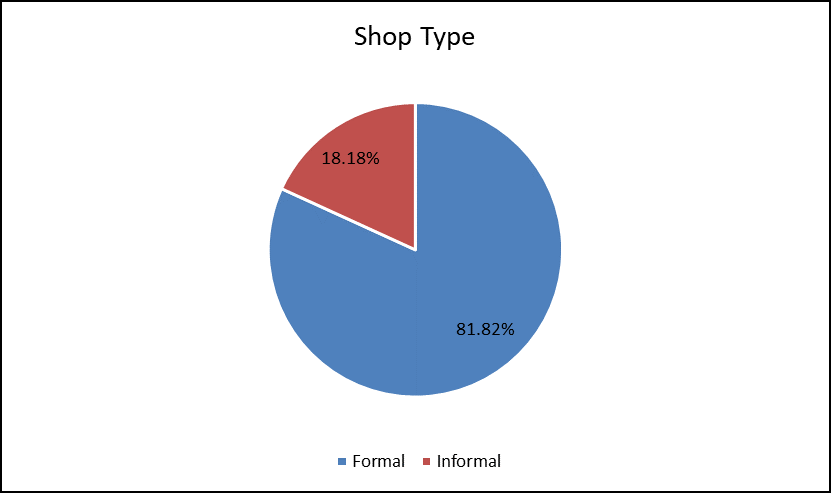
Fig No. 1.5
This upper pie chart represents the shop type such as formal and informal. Formal shops are more in compare to informal type of shops. Formal shops have 81.82% and other is informal having 18.18% of total numbers. This indicates that most business are operated with structured and at regulated framework. While smaller portion of population are less having informal shops because of they didn’t have licence such as hawkers they shifted from one place to another for sailing their goods to the people. due to they didn’t want to pay taxes, for licence and etc so they have informal shopsbut majority of people having their formal shops means people are passioned towards their business and also with the legal documentation process.
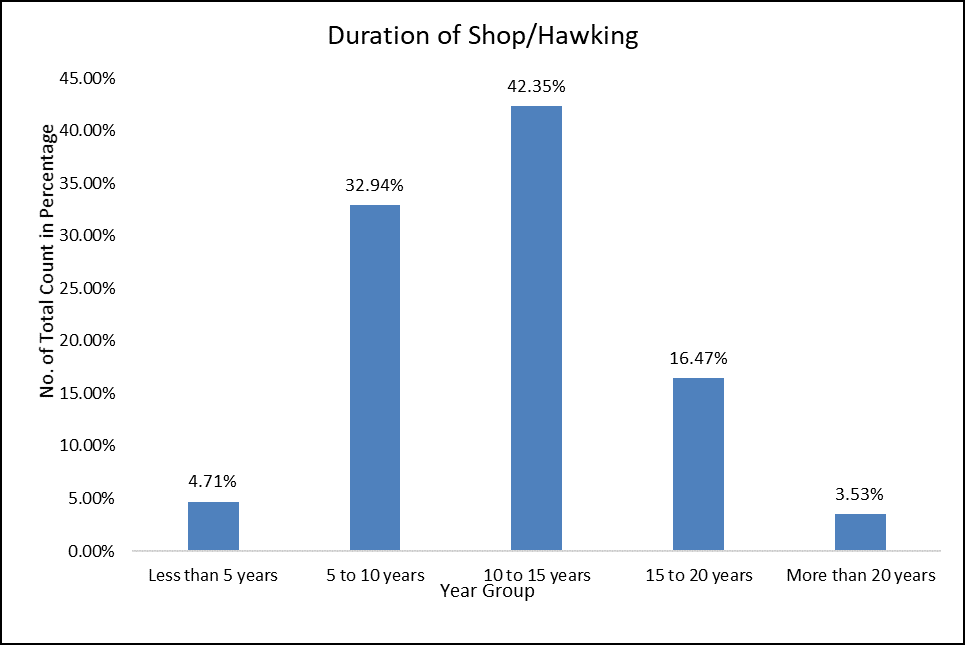
Fig No. 1.6
This upper bar graph shows how long shopkeepers are hawkers in the business. Most of the shops are running from the 10 to 15 years which was 42.35% of total number. This shown that people are actively engaging in their business and having their own shops still many years. Next category is 5 to 10 years in this category of having shops 32.94% of people having their shops since 5 to 10 years. It shows that lot of business are fairly stable and they survived to buildcustomer’s trust. Next category of 15 to 20 years having 16.47% of shops running from 15 to 20 years its suggests that only fewer business sustain from very long period. In less than 5 years category of shops having 4.71% compare to others. They newly open their shops in those areas for sailing their goods to the people. last category is more than 20 years. In this category having 3.53% of people having their shopssince longer time but they having less percentage compare to all. Because they shifted their shops to another areas and other possible reason is that they sale it to other people to owned shop.
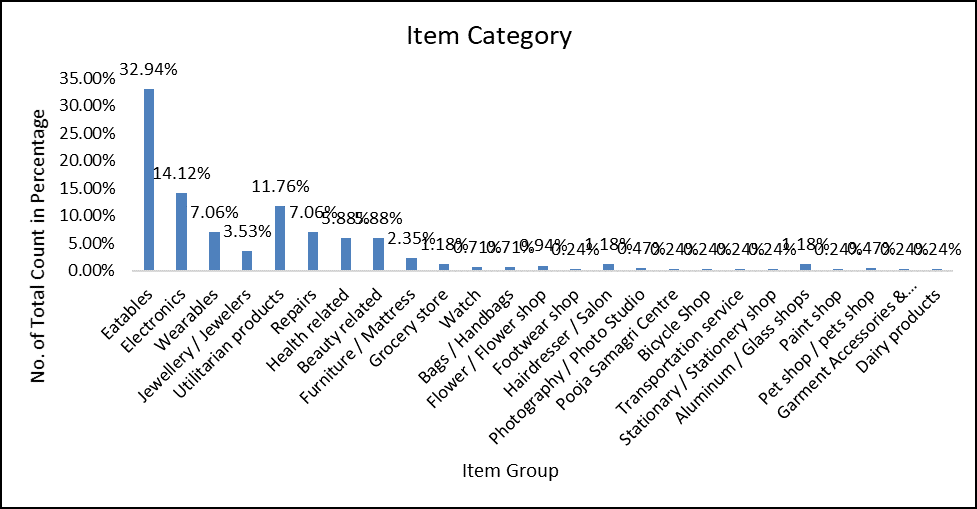
Fig No. 1.7
This upper bar graph represents which items they sold in their shops such as eatables, wearables, electronic, grocery also other like dairy productsand etc. the largest data of having eatables of 32.94% of total percentage compare to all they may having their own food stalls or bakers and, in that ward, maximum people having eatable shops, because people may purchase as per their need of food. Electronics are in the second largest of having 14.12% of compare to other. Indicates growing demand for gadgets and electronic goods. Next is repairs having 7.06% of people who having their repairing shops such as car repairs, repairing materials they have in that area. followed by jewellers, utilitarian products and others are also in that area. because now a days people having more facilities so they need more different variety of the shops to full fill their needs. And it’s good that in R/S ward having variety of shops so people didn’t find any trouble to find particular thingbehind that area.
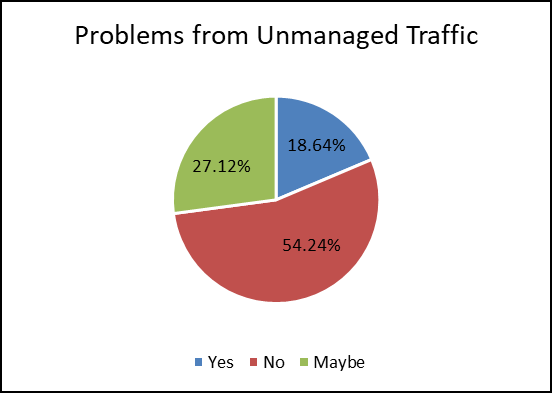
Fig No. 1.8
The upper pie chart indicates that shopkeepers and hawkers face issues like unmanage traffic. So, majority of shopkeepers and hawkers didn’t face any issue from traffic because they my have their shops behind the footpath not exactly touching the road so traffic problem didn’t getsoccurredany, they don’t feel any issues related to the traffic in the case of more people visited their shops. Nextcategory of maybe having 27.12% shopkeepers and hawkers sometimes at peak time and also at rainy season, road construction they may feel traffic kind of issues. As per daily basis they didn’t feel that traffic issues are more. And the no category people having 18.64% means only fewer category of shopkeepers and hawkers didn’t face traffic related issues because of the width of the road so no more traffic problems happen.
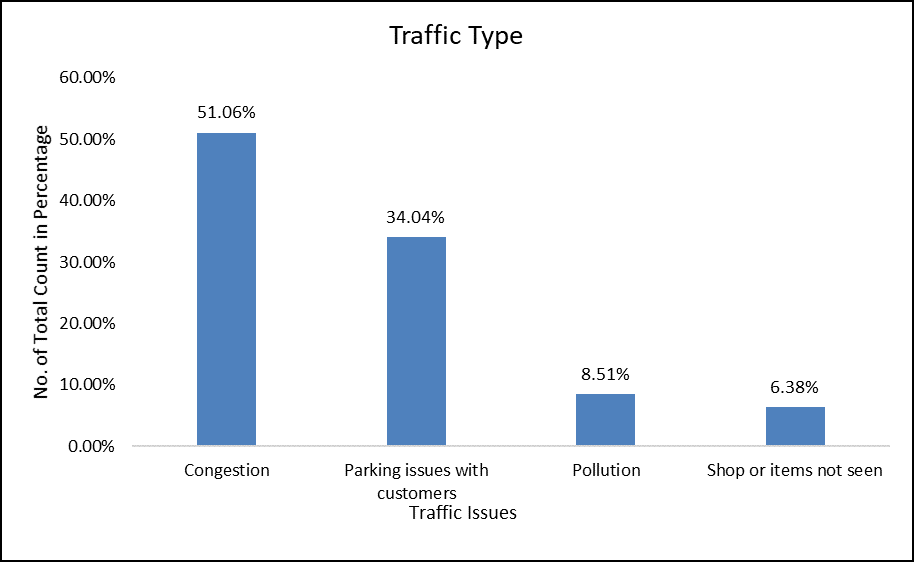
Fig No. 1.9
The upper bar graph indicates traffic type faced by shopkeepers and hawkers. Majority of people faced congestion which was 51.06% of shopkeepers facing congestion due to road construction, accidents, long time singles so the road was fully loaded with the vehicles. Other is parking issue with customers having 34.04% compare to others. Because the width of the road is small and due to parking beside the road it gets rush to that particular area and people face parking issues other reason is many shopkeepers followed no parking behind their shop so customers and other people find difficult to park their vehicles near that road. In next category pollution having 8.51% of shopkeepers and hawkers facing pollution emitted from the vehicles such as smoke, loud Noice of horns. But this may have very less percentage of 8.51% because many shops having doors to get less affected from it and mostly hawkers get affected easily because they just having their stall with no doors. Last category of items not seen said by shopkeepers indicates that due to traffic their shop items aren’t visible to the people so they faced issues like people not coming because they didn’t see the shop items.
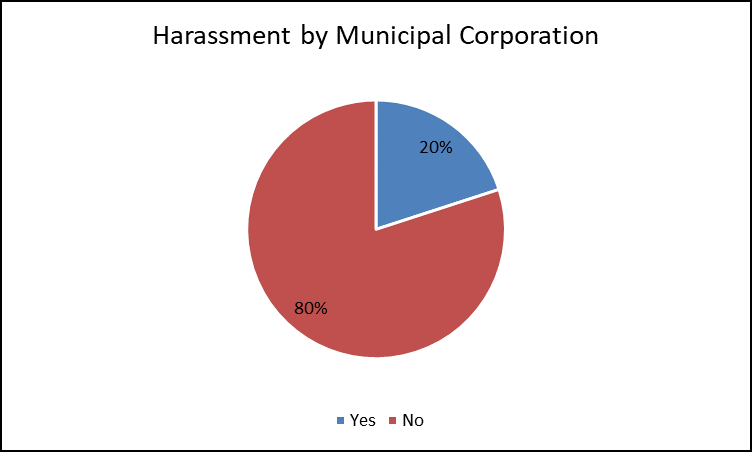
Fig No. 1.10
The uppers pie chart represents if shopkeepers and hawkers get harassed by the municipal corporation people. 20% of shopkeepers and hawkers gets harassed by the municipalcorporation for having their shop in that area.the harassment they get such as raids, dispute over licence, they demand for continuous payment and force them to give so they may feel gets harassed by the municipal corporation people. others they didn’t gets harassed because they may have licence and know their right that if they have their own legal shop with licence then no one can harass them fours fully.And they know about how to file complain against them.
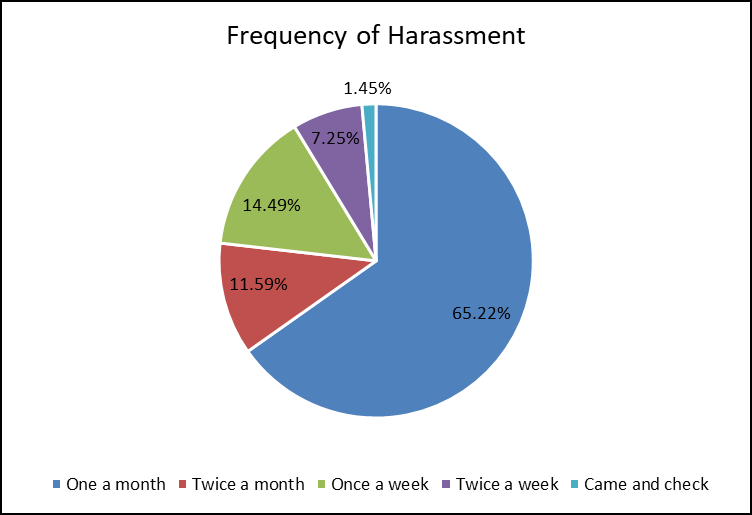
Fig No. 1.11
This upper pie chart represents frequency of shopkeepers and hawkers gets harass by municipal corporation. 62.22% of people harassed by them in once a month. Indicates that they came and ask if they have licence to owned this shop. Twice a month having 11.59% of shopkeepers and hawkers says that they visited twice in the month for harassing them and another reason is they come for checking purpose as well. Next category fall under once-a-week category having 14.49% of shopkeepers and hawkers said that they come once in a week and harassed them pressurise them to pay them. twice a week category having 7.25% of shopkeepers and hawkers faced this twice in the week. And last category of people they said they just come and check they didn’t ask for any fine and penalties and they didn’t even harass them due to they also know that this people having rights.
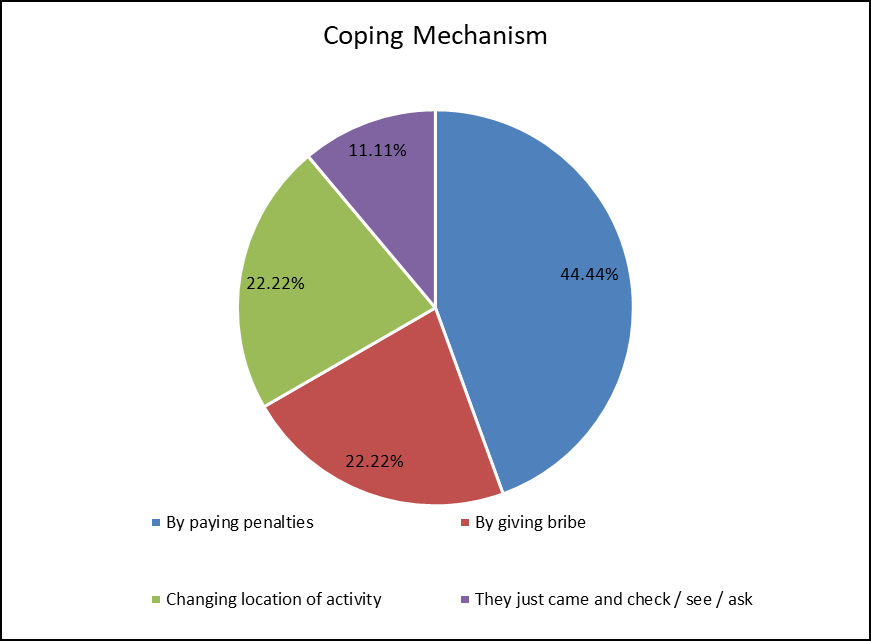
Fig No. 1.12
This upper pie chart represents coping mechanism of the shopkeepers and hawkers that how they deal withthe municipal corporation people while they harassed them for having shop in thatarea.the first category of by paying penalties having 44.44% of shopkeepers and hawkers paying penalties to the municipal corporation peoplewhile they harassed them. Because they have fear of if they won’t pay them, then they permanently closed their shop. But these shopkeepers and hawkers want to know about their rights so they didn’t get harassed. Another reason is having illegal shops such as with no licence so they easily get trapped and pay to them. Another category is by giving bribe is having 22.22% of shopkeepers and hawkers fallen under this category that they give bribe probably this type of shops didn’t have legal licence so they charged them by giving bribe to saved their shop that’s why they give. Next category is changing location for activity having 22.22% of shopkeepers and hawkers change their location for activities mostly hawkers do that they change location for activity to sale their goods to people. because municipal corporation people want legal licence of a particular shop of a particular area. but most of the hawkers and shopkeepers didn’t have that so they change their location for selling their goods. Last category is having different coping mechanism they said that the municipal corporation people just came and check at once they didn’t ask for any kind of penalties to pay to them. This may indicate that they came to check their shop licence, their products because is they have licence to sale these products probably medical shops they have drugs as well but they have licence to sale it as a medicine with legal doctor’s prescription so they need to check about that.
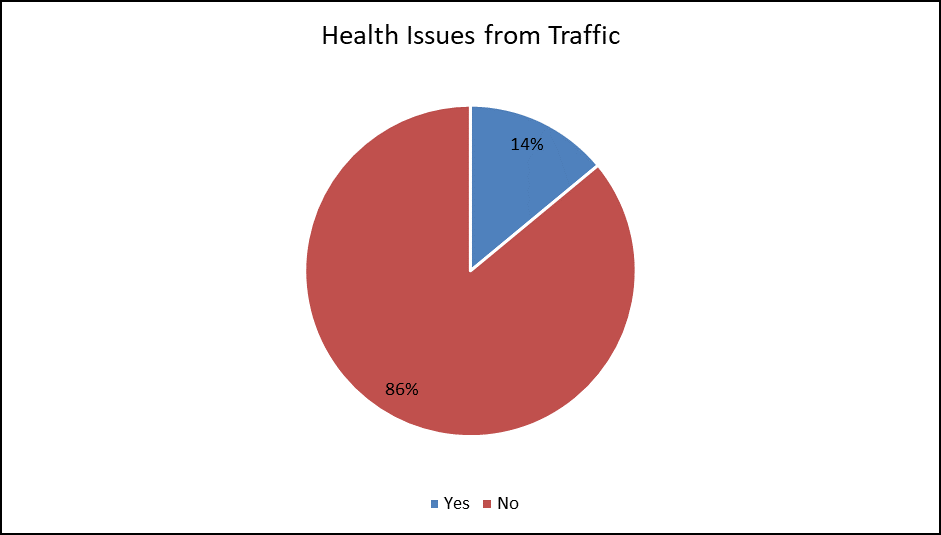
Fig No. 1.13
This upper pie chart represents if the shopkeepers and hawkers faced any health issues due to traffic. Majority of shopkeepers and hawkers says no that they didn’t face any health issues; that’s the good thing that they didn’t face any issues but most of the shops having doors so there are very less chances to gets trapped in it. Another reason is that now a days people believed in eco-friendly practices so most of the vehicles are E-vehicles they won’t depend on fuel so less fuel vehicles used the less pollution it releases. And less harm to the environment and species. The people who say yes having 14% of the total compare to no category people.it’s really not a good thing because studies show that the smoke releases from the vehicles are more danger than the cigarette smoke. The harmful gases emitted from the vehicles includes carbon monoxide (CO), nitrogen oxides(NOx), hydrocarbons (VOCs), and particulate matter. This was very harmful to that living organism who injectthese gases. But good thing is that the percentage of pollution due to vehicles are less compare to past decades and in next several years it falling under 2% to 7% category.
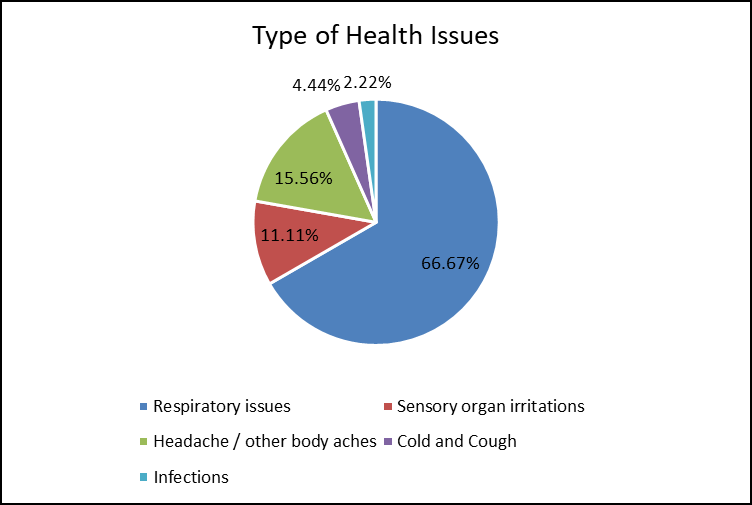
Fig No. 1.14
This upper pie chart represents which type of health issues faced by shopkeepers and hawkers due to pollution. The highest percentage of category is respiratory issues. they have breathing related problem means due to pollution its cause them difficult to breathe. It’s such a major issue that people face such problems because all living organisms need fresh air to breathe that they won’t get itto released such issues. Next category of sensory organ irritation having 11.11% of shopkeepers and hawkers having that problem because of polluted air this may mostly saw in the hawkers because they don’t have proper door shops so this air gets easily harm them compare to shopkeepers. Other category is headache / other body aches having15.56% of shopkeepers and hawkers. because of horn in the traffic areas. vehicles continuously honking the horn that reacts on the shopkeepers and hawkers’ health. Last two categories of could and cough 4.44% and infections 2.22% compare to other reactions due to traffic. The reason of having cold and cough is polluted air, emitted air from the vehicle people injects them through breathing because in the air we have mixture of the of gasesand when we breathe its going in our body and affects inner body parts as well. The solution is E-vehicles and if honking the horn is not necessary then we not released the unnecessary horn in traffic areas because it’s harming the all living beings. And affects them badly.
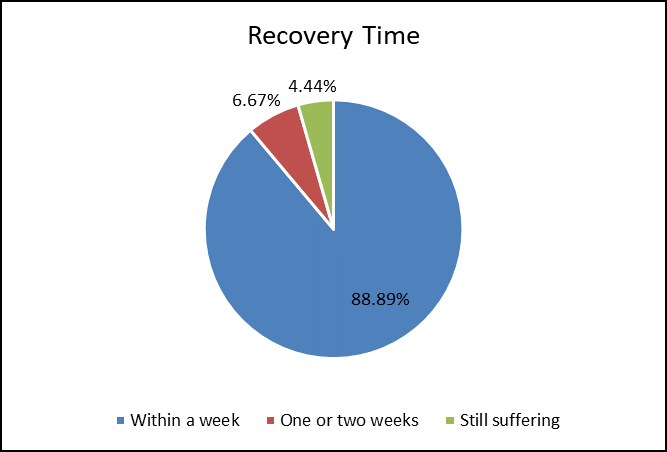
Fig No. 1.15
This upper pie chart indicates that how much time to gets recover from the affected pollution. The highest percentage of category is within a week having 88.89% compare to others. That’s a really good thing that people not get suffer much they healed within a week through it. Second category is one and two weeks having 6.67% of people probably they are elderly people and also a people who gets suffer more than the other because every person’s immunity power are different than others to heal from it. Last but not the least is still suffering category having 4.44% of the shopkeepers and hawkers come under it. Through this data we come to know that how much pollution releases from the vehicles in traffic areas are more harmful that people still suffer from it. Majority of the people who are hawkers because they just have their stall with no door facility so they easily get affected through it. Solution is that vehicles have to use less fuel and use public vehicles, if it’s an emergency to use own vehicle at that time they used their own vehicle. And instead of fuel people used E-vehicles. Also, planting trees are more important to heal from the affected pollution because in urban areas main problem is they have fewer green areas than the rural area. so, planting a tress beside the road is must important to cope up from it.
Major Findings:
- Majority of shopkeepers and hawkers belong to the 30 to 40 age group categories.
- Majority of the shopkeepers and hawkers are male – dominated people.
- Most of the shops are formal.
- More educated individuals having their own shop and stalls compare to illiterate.
- Eatable shops and stalls are most commonly found in this ward.
- 86% of people reported they have health issues from the pollution.
- People those who have informal shops and stalls faced harassment from municipal corporation people.
Suggestion:
- Market areas and traffic areas have proper parking facility so the induvial parks their vehicles properly.
- Promote more E-vehicles in urban areas.
- Enforcing strict action against municipal corporation people who continuously harassed shopkeepers and hawkers.
- Encourage eco-friendly practices in every area.
- Enforces no horning zones in the market areas.
- Using smart traffic signals to reduced congestion in the traffic areas.
Conclusion:
H1: Majority of respondents experience health problems due to traffic pollution
H10: Majority of respondents do not experience health problems due to traffic pollution
The data provide very strong evidence to reject the null hypothesis that only 50% (or fewer) of shopkeepers/hawkers experience health problems related to traffic pollution. The observed proportion (86.7%) is significantly greater than 50% (z ≈ 4.92, p ≈ 4.3×10⁻⁷). The 95% confidence interval (≈ 76.7% to 96.6%) also supports that a large majority are affected.
The studies shown that the R/S ward of Grater Mumbai have some direct and indirect impacts on shopkeepers and hawkers. They faced health issues due to traffic areas not just physically they affected but it affects their mental wellbeing as well. some of they may recover faster but others take time to recover from it. Also, municipal staff harassed them and force them to pay penalties. One of the shopkeepers said that they having shop since the last 20 years with proper licence of the shop still the municipal corporation people came and force them to pay money. then only they cleared the traffic otherwise they didn’t clear it. So, such type of harassment they faced. Thus, while studied all of this through collected data from the shopkeepers and hawkers’ certain effective strategies should be planned to cope up from this is that having effective traffic management, and perform Eco-Friendly practices. And if the municipal staff harassed them then without fear they may file complain against them who harassed them. But other shopkeepers said that they came and check licence and everything is legal item to sold by shopkeepers and hawkers then they do their work really well to know about it.
References
- (Kumar, 2021). Study on road traffic congestion: A review. https://www.researchgate.net/publication/352549014_Study_on_road_traffic_congestion_A_review
- (Arregi, 2024). Road traffic noise exposure and its impact on health: evidence from animal and human studies—chronic stress, inflammation, and oxidative stress as key components of the complex downstream pathway underlying noise-induced non-auditory health effects https://pmc.ncbi.nlm.nih.gov/articles/PMC11297122/
- (Mullur, 2020). Impact of Automobile Emission on Pulmonary Function Parameters of Non-Smoking Road Side Vendors and Shopkeepers https://digitallibrary.bldedu.ac.in/bitstream/123456789/3546/1/1690.pdf
- (Huong, 2020)Health Impacts of Traffic-related Air Pollution: Cause-effect Relationships and Mitigating Measures https://www.researchgate.net/publication/336437559_Health_Impacts_of_Traffic-related_Air_Pollution_Cause-effect_Relationships_and_Mitigating_Measures
- (Banerjee, 2012) Research on road traffic noise and human health in India: Review of literature from 1991 to currenthttps://research-repository.griffith.edu.au/server/api/core/bitstreams/bc728ed8-d075-5d41-b077-862a157c5fee/content