
| Bhim Singh (Research Scholar) Department of Geography University of Rajasthan Jaipur (Rajasthan) India | Dr. Anil Kumar Yadav (Assistant Professor) Department of Geography Alankar P.G. Mahavidyalaya Jaipur(Rajasthan) India |
Abstract
Rajasthan has a distinctive agricultural environment characterized by arid and semi-arid conditions, irregular rainfall, and considerable spatial variation in water availability. In this context, irrigation plays an important role in increasing the utilization of agricultural land and enabling multiple cropping. The present study examines the changing trends in agricultural land use, irrigation, cropping intensity, and irrigation intensity in Rajasthan during 2007-08 to 2022-23. The study uses secondary data on indices of net and gross sown area, net and gross irrigated area, cropping intensity, irrigation intensity, and their respective indices. Descriptive analysis and percentage-change calculations were employed to identify temporal changes. The findings indicate that the index of net sown area increased from 101.17 in 2007-08 to 109.02 in 2022-23, while the gross sown area index increased from 101.81 to 129.14. More substantial growth occurred in irrigation: the net irrigated area index increased from 100.51 to 148.18, and the gross irrigated area index rose from 101.68 to 158.18. Cropping intensity increased from 129.91% to 152.92%, whereas irrigation intensity increased from 125.52% to 132.45%. Thus, irrigation expansion was considerably stronger than the increase in irrigation intensity, while cropping intensity showed a substantial long-term improvement. The findings suggest that irrigation development has supported agricultural intensification, although the increase in cropping intensity is also influenced by factors such as rainfall, crop choice, technology, and farm-management practices. Sustainable agricultural development in Rajasthan requires efficient irrigation, groundwater conservation, crop diversification, and climate-resilient farming.
Keywords: Rajasthan, agricultural intensification, cropping intensity, irrigation intensity, irrigated area, sown area, agricultural land use.
INTRODUCTION
Agriculture is an important component of Rajasthan’s rural economy, but agricultural production is constrained by the state’s predominantly arid and semi-arid climate, uneven rainfall, recurrent droughts, and unequal distribution of water resources. Rajasthan contains substantial agro-climatic variation, with the western part dominated by arid conditions and several eastern and southeastern regions having comparatively more favourable agricultural conditions (Government of Rajasthan, 2022).
Under such circumstances, irrigation is an important determinant of agricultural land utilization. Irrigation reduces dependence on uncertain rainfall and can make it possible to cultivate crops during additional seasons. Consequently, expansion in irrigated area can contribute to an increase in gross cropped area and cropping intensity. The Government of Rajasthan has also emphasized efficient irrigation and water management as important components of agricultural development (Government of Rajasthan, 2017).
Cropping intensity is an important indicator of agricultural intensification. It reflects the extent to which the same agricultural land is cultivated more than once during an agricultural year. It is generally calculated as the ratio of gross sown area to net sown area multiplied by 100. Similarly, irrigation intensity is calculated as the ratio of gross irrigated area to net irrigated area multiplied by 100 (Directorate of Economics & Statistics [DES], 2023).
Official Rajasthan agricultural statistics provide annual information on land utilization, irrigated area, cropping intensity, irrigation intensity, and related indices. The 2022-23 agricultural statistics report a cropping intensity of 152.92% and irrigation intensity of 132.45% for the state (DES, 2023). These indicators provide an important basis for assessing changes in the intensity of agricultural land and water utilization.
Against this background, the present study analyses the trends in sown area, irrigated area, cropping intensity, and irrigation intensity in Rajasthan over the period 2007-08 to 2022-23.
STUDY AREA
The study covers the entire state of Rajasthan in northwestern India. With a geographical area of approximately 342,239 square kilometres, Rajasthan is India’s largest state by area. Its physical environment ranges from the desert landscape of western Rajasthan to relatively more favourable agricultural conditions in the eastern and southeastern parts.
The state experiences substantial spatial variation in rainfall and water availability. Western Rajasthan is particularly dependent on irrigation because of low and highly variable rainfall, while irrigation also plays an important role in intensifying agriculture in other regions. Wells, tube wells, canals, and other sources contribute to agricultural irrigation. The Indira Gandhi Canal has been particularly significant for agricultural development in northwestern Rajasthan (Government of Rajasthan, 2022).
This combination of climatic constraints, agricultural dependence, and increasing irrigation makes Rajasthan an appropriate case for examining the relationship between irrigation development and agricultural intensification.
OBJECTIVES
The study aims to:
- Examine changes in the indices of net and gross sown area in Rajasthan from 2007-08 to 2022-23.
- Analyse changes in the indices of net and gross irrigated area.
- Examine the trend in cropping intensity.
- Analyse the trend in irrigation intensity.
- Compare changes in cropping intensity with irrigation intensity.
- Discuss the implications of these trends for sustainable agricultural development in Rajasthan.
RESEARCH METHODOLOGY
The study is based on secondary data covering sixteen agricultural years from 2007-08 to 2022-23. The numerical dataset used in the analysis contains indices of net sown area, gross sown area, net irrigated area, gross irrigated area, cropping intensity, irrigation intensity, index of cropping intensity, and index of irrigation intensity.
The official agricultural-statistics publications of the Directorate of Economics & Statistics, Government of Rajasthan, were used to support the definitions and contextual interpretation of the indicators (DES, n.d.; DES, 2023).
Cropping intensity was examined using:
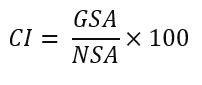
where CI represents cropping intensity, GSA represents gross sown area, and NSA represents net sown area.
Irrigation intensity was examined using:
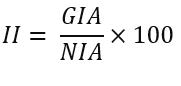
where II represents irrigation intensity, GIA represents gross irrigated area, and NIA represents net irrigated area (DES, 2023).
The analysis is primarily descriptive. The study identifies long-term trends, annual fluctuations, and differences in the growth of sown-area and irrigation indicators. The percentage changes reported below are the author’s calculations based on the supplied dataset.
RESULTS AND DISCUSSION
Changes in Sown Area
The data reveal a relatively modest increase in the index of net sown area compared with the increase in gross sown area. The net sown area index increased from 101.17 in 2007-08 to 109.02 in 2022-23, representing an increase of approximately 7.76%.
In contrast, the gross sown area index increased from 101.81 to 129.14, representing an increase of approximately 26.84%.
The substantially faster growth of gross sown area indicates greater utilization of existing agricultural land through repeated cultivation. This is an important feature of agricultural intensification because increasing gross cropped area does not necessarily require a comparable expansion of net cultivated land.
The pattern is consistent with the role of cropping intensity as an indicator of land-use intensity. Official agricultural statistics distinguish between net and gross sown areas precisely because land cultivated more than once contributes to gross area without increasing net area (DES, 2023).
Changes in Irrigated Area
Irrigation indicators experienced much stronger growth than the sown-area indicators.
The index of net irrigated area increased from 100.51 in 2007-08 to 148.18 in 2022-23, an increase of approximately 47.43%.
The index of gross irrigated area increased from 101.68 to 158.18, representing an increase of approximately 55.58%.
The faster growth of gross irrigated area than net irrigated area indicates increasing utilization of irrigated land for repeated cultivation. The trend is particularly important for Rajasthan because irrigation can reduce farmers’ dependence on variable rainfall and permit cultivation beyond the principal rainy season.
Official statistics support the strong growth recorded toward the end of the period. Gross irrigated area increased from about 118.65 lakh hectares in 2021-22 to approximately 125.83 lakh hectares in 2022-23, while net irrigated area increased from about 89.24 lakh hectares to 95.00 lakh hectares (DES, 2023).
The results therefore suggest that irrigation expansion has been one of the most significant changes in Rajasthan’s agricultural system during the study period.
Table 1 : Indices of Net and Gross Sown Area and Irrigated Area in Rajasthan, 2007-08 to 2022-23
| Year | Index of Net Sown Area | Index of Gross Sown Area | Index of Net Irrigated Area | Index of Gross Irrigated Area |
| 2007-08 | 101.17 | 101.81 | 100.51 | 101.68 |
| 2008-09 | 103.86 | 104.39 | 97.41 | 99.43 |
| 2009-10 | 100.45 | 99.68 | 91.24 | 91.88 |
| 2010-11 | 108.58 | 119.2 | 103.89 | 104.61 |
| 2011-12 | 106.72 | 112.34 | 111.08 | 111.92 |
| 2012-13 | 103.43 | 109.81 | 116.97 | 118.86 |
| 2013-14 | 108.1 | 119.74 | 119.32 | 124.01 |
| 2014-15 | 103.69 | 111.1 | 122.94 | 127.86 |
| 2015-16 | 106.66 | 114.67 | 123.81 | 132.78 |
| 2016-17 | 107.52 | 119.35 | 128.79 | 134.82 |
| 2017-18 | 105.94 | 114.92 | 124.55 | 133.3 |
| 2018-19 | 105.2 | 116.04 | 129.19 | 138.55 |
| 2019-20 | 106.71 | 126.14 | 137.59 | 148.19 |
| 2020-21 | 106.21 | 119.65 | 136.92 | 146.52 |
| 2021-22 | 107.28 | 125.8 | 139.19 | 149.15 |
| 2022-23 | 109.02 | 129.14 | 148.18 | 158.18 |
Trend in Cropping Intensity
Cropping intensity increased from 129.91% in 2007-08 to 152.92% in 2022-23. The increase of 23.01 percentage points represents approximately 17.71% growth relative to the initial value.
The trend was not uniform across all years. Cropping intensity declined from 129.91% in 2007-08 to 128.10% in 2009-10, after which it increased substantially to 141.71% in 2010-11. Further fluctuations occurred during the middle of the period, but the general long-term trend remained upward.
The highest value in the supplied series was 152.92% in 2022-23, while the lowest was 128.10% in 2009-10.
The official Rajasthan agricultural statistics confirm the 2022-23 value and report an increase from 151.36% in 2021-22 to 152.92% in 2022-23 (DES, 2023). The increase indicates greater utilization of cultivated land through multiple cropping.
Trend in Irrigation Intensity
Irrigation intensity increased from 125.52% in 2007-08 to 132.45% in 2022-23. This represents an increase of 6.93 percentage points or approximately 5.52%.
The growth was therefore much lower than that of cropping intensity. The highest irrigation intensity recorded in the supplied data was 133.64% in 2019-20. It subsequently declined to 132.78% in 2020-21, increased slightly to 132.96% in 2021-22, and declined again to 132.45% in 2022-23.
Table 2:
Cropping Intensity, Irrigation Intensity and Their Indices in Rajasthan,2007-08 to 2022-23
| Year | Cropping Intensity (%) | Irrigation Intensity (%) | Index of Cropping Intensity | Index of Irrigation Intensity |
| 2007-08 | 129.91 | 125.52 | 100.64 | 101.16 |
| 2008-09 | 129.74 | 126.66 | 100.51 | 102.08 |
| 2009-10 | 128.1 | 124.94 | 99.24 | 100.69 |
| 2010-11 | 141.71 | 124.94 | 109.78 | 100.69 |
| 2011-12 | 135.88 | 125.01 | 105.26 | 100.75 |
| 2012-13 | 137.04 | 126.09 | 106.16 | 101.62 |
| 2013-14 | 142.98 | 128.96 | 110.76 | 103.93 |
| 2014-15 | 138.32 | 129.04 | 107.15 | 104 |
| 2015-16 | 138.78 | 133.06 | 107.51 | 107.24 |
| 2016-17 | 143.3 | 129.88 | 111.01 | 104.68 |
| 2017-18 | 140.03 | 132.79 | 108.47 | 107.03 |
| 2018-19 | 142.39 | 133.06 | 110.3 | 107.24 |
| 2019-20 | 152.59 | 133.64 | 118.21 | 107.71 |
| 2020-21 | 145.42 | 132.78 | 112.66 | 107.01 |
| 2021-22 | 151.36 | 132.96 | 117.26 | 107.16 |
| 2022-23 | 152.92 | 132.45 | 118.46 | 106.75 |
Source: Compiled from the data provided for the study.
The official statistics report the same value of 132.45% for 2022-23 and indicate a small decline from the previous year (DES, 2023).
The relatively stable pattern in recent years suggests that expansion of irrigated area has been more significant than increasing the frequency of irrigation on already irrigated land.
Changes in the Indices of Cropping and Irrigation Intensity
The index of cropping intensity increased from 100.64 in 2007-08 to 118.46 in 2022-23, representing approximately 17.71% growth.
The index of irrigation intensity increased from 101.16 to 106.75, representing approximately 5.52% growth.
The difference between these two indicators is significant. Cropping intensity increased more than three times as much as irrigation intensity in relative terms. This suggests that agricultural intensification cannot be attributed solely to more intensive use of irrigation.
Other factors may have contributed to the increase in cropping intensity, including improved agricultural technology, crop diversification, changes in market incentives, farm-management practices, rainfall conditions, and government agricultural programmes. Irrigation nevertheless provides an important enabling condition for multiple cropping, particularly in water-constrained environments such as Rajasthan (Government of Rajasthan, 2017).
Comparative Analysis
| Indicator | 2007-08 | 2022-23 | Percentage Change |
| Net Sown Area Index | 101.17 | 109.02 | 7.76% |
| Gross Sown Area Index | 101.81 | 129.14 | 26.84% |
| Net Irrigated Area Index | 100.51 | 148.18 | 47.43% |
| Gross Irrigated Area Index | 101.68 | 158.18 | 55.58% |
| Cropping Intensity (%) | 129.91 | 152.92 | 17.71% |
| Irrigation Intensity (%) | 125.52 | 132.45 | 5.52% |
| Index of Cropping Intensity | 100.64 | 118.46 | 17.71% |
| Index of Irrigation Intensity | 101.16 | 106.75 | 5.52% |
Source: Author’s calculations based on the data supplied for the study.
The comparison shows that the largest relative increase occurred in the gross irrigated area index, followed by the net irrigated area index. The increase in gross sown area was also considerably greater than the increase in net sown area.
This pattern indicates a transition toward greater agricultural intensification. The relatively small increase in net sown area, combined with larger increases in gross sown and irrigated areas, suggests that increased agricultural activity has been achieved partly through more frequent cultivation of existing land.
Irrigation and Agricultural Intensification
The long-term data show a broad positive association between irrigation development and agricultural intensification. As the irrigated-area indices increased, cropping intensity also showed an upward trend.
The relationship is agriculturally logical. Irrigation provides farmers with greater control over water availability and can enable cultivation during seasons when rainfall is insufficient. This can increase the number of crops grown on the same parcel of land.
However, the growth rates demonstrate that irrigation is not the only determinant. The gross irrigated-area index increased by approximately 55.58%, whereas the cropping-intensity index increased by approximately 17.71%. The difference indicates that the response of cropping intensity to irrigation expansion is influenced by other economic, technological, environmental, and institutional factors.
Previous research has also indicated the importance of irrigation in determining cropping intensity in parts of Rajasthan, although regional conditions differ considerably across the state (Archana, 2021). Therefore, the statewide relationship should be understood as a broad association rather than a direct causal relationship.
Conclusion
The study examined changes in agricultural land use, irrigation, cropping intensity, and irrigation intensity in Rajasthan between 2007-08 and 2022-23. The findings demonstrate a clear long-term trend toward greater agricultural intensification.
The net sown area index increased by only 7.76%, while the gross sown area index increased by 26.84%. This indicates that repeated cultivation became more important than simple expansion of cultivated land.
The strongest growth occurred in irrigation. The net irrigated-area index increased by 47.43%, while the gross irrigated-area index increased by 55.58%. This substantial expansion created greater opportunities for farmers to cultivate crops during multiple seasons.
Cropping intensity increased from 129.91% to 152.92%, representing 17.71% growth, whereas irrigation intensity increased from 125.52% to 132.45%, representing only 5.52% growth. Thus, cropping intensity increased much more rapidly than irrigation intensity.
The results suggest that irrigation development has played an important supporting role in Rajasthan’s agricultural transformation. Nevertheless, the differences between the indicators indicate that agricultural intensification is also influenced by factors such as rainfall, crop selection, technology, market conditions, and farm-management practices.
For future agricultural development, Rajasthan needs to combine irrigation expansion with efficient water use. Micro-irrigation, groundwater recharge, rainwater harvesting, watershed development, crop diversification, and climate-resilient farming can help increase agricultural productivity while reducing pressure on limited water resources.
The central policy challenge is therefore not merely to increase irrigation but to ensure that agricultural intensification remains economically productive, environmentally sustainable, and resilient to climate variability.
Policy Recommendations
The study suggests the following measures:
- Promote micro-irrigation: Drip and sprinkler systems should be expanded to improve water-use efficiency.
- Conserve groundwater: Irrigation development should be accompanied by groundwater monitoring and recharge measures.
- Strengthen rainwater harvesting: Farm ponds, check dams, and watershed programmes should be expanded in water-stressed regions.
- Encourage crop diversification: Farmers should be supported in adopting crops that provide favourable returns with lower water requirements.
- Promote sustainable multiple cropping: Higher cropping intensity should be accompanied by soil-health conservation.
- Adopt climate-resilient agriculture: Drought-tolerant varieties, weather advisories, crop insurance, and improved farm practices should be strengthened.
- Use region-specific planning: Agricultural policies should recognize the substantial differences between western arid Rajasthan and relatively better-watered eastern and southeastern regions.
References,Notes and Bibliography:
- Archana. (2021). A study of variation in cropping and irrigation intensity in IC hyper arid partially irrigated zone. Kala Sarovar, 24(1–II), 20–24.
- Directorate of Economics & Statistics. (n.d.). Rajasthan agricultural statistics. Government of Rajasthan. Rajasthan Directorate of Economics & Statistics
- Directorate of Economics & Statistics. (2023). Agricultural statistics 2022-23. Government of Rajasthan. Agricultural Statistics 2022-23
- Government of Rajasthan. (2017). Strategies for doubling farmers’ income. Department of Agriculture, Government of Rajasthan.
- Government of Rajasthan. (2022). State action plan on climate change. Government of Rajasthan.