| Pratishtha Research Scholar (Geography) R.R. Morarka Govt. College Jhunjhunu (Rajasthan) | Prof. Maan Singh Department of Geography R.R. Morarka Govt. College Jhunjhunu (Rajasthan) |
Abstract
Urbanization is one of the most important demographic and spatial processes reshaping the districts and cities of Rajasthan, leading to significant changes in regional economic structure, settlement morphology, and service concentration. Sikar district, located in the Shekhawati region, has also experienced notable transformation in its population size, composition, and settlement pattern over the last three decades. This study examines the changing trends of urbanization in Sikar district using secondary data drawn from the Census of India for 1991, 2001, and 2011, along with district census handbooks, official statistical publications, and selected planning documents. Although the title extends to 2021, official district-level census data for 2021 are not yet available because the Census 2021 exercise was delayed; therefore, the core analysis remains based on the officially comparable census years 1991, 2001, and 2011. In addition, an indicative estimated population series for 2011–2025 has been included only to illustrate the likely post-2011 demographic direction and not as a substitute for official census counts. The study applies descriptive statistics, urbanization ratios, decadal growth analysis, and comparative assessment with Rajasthan and India. The findings show that Sikar’s total population increased from 1,842,914 in 1991 to 2,287,788 in 2001 and 2,677,333 in 2011, while the urban population rose from 387,521 to 472,538 and then to 633,906 during the same period. The urban share changed from 21.03% in 1991 to 20.65% in 2001 and increased to 23.68% in 2011, indicating that urbanization in the district was not perfectly linear but accelerated strongly during 2001–2011. Comparative analysis shows that Sikar remained below the urbanization levels of both Rajasthan and India, although by 2011 it had moved closer to the state average. The estimated post-2011 trend further suggests continued demographic
expansion, with the district population reaching about 30.00 lakh by 2025. The study concludes that Sikar is undergoing gradual but significant urban transition, driven by administrative centrality, educational growth, transport development, commercial expansion, and the rise of service centres. These findings underline the need for future district planning to combine demographic analysis with GIS-based land-use assessment, infrastructure expansion, and improved urban management.
Keywords: Urbanization, Sikar district, Rajasthan, census analysis, urban population, demographic change, district planning.
1. Introduction
Urbanization is usually understood as the increasing concentration of people in space classified as urban‚ but the term can also include all the spatial‚ lifestyle‚ customary‚ land use‚ infrastructure and social change entailed by the demographic transition․ Customarily‚ urbanization was seen as a part of a general transition from an agricultural to an industrial society (Trewartha 1969)․ More recently‚ urban studies stressed the role of technological change‚ transportation‚ mobility of labor‚ access to urban markets and government investment for urban growth (Knox & McCarthy‚ 1994; Davis‚ 1965)․ Urbanization in India has been more than demographic change․ It has given geographical expression to the changes in the structure and diversity of employment opportunities‚ inequalities among regions and the increasing role of government and market forces (Bhattacharya‚ 2002; Kundu‚ 2011)․
Rajasthan has been less urbanized than many other states of India․ The state has developed urban centres that mainly focus on administration‚ education and commerce‚ industry‚ and tourism․ Data related to urban population and urban demographics‚ based on census and urban demographic surveys‚ show that in 1991 the urban population of Rajasthan was 22․88% of the total population․ This percentage grew to 23․39% in 2001‚ and 24․87% in 2011․ However the overall percentage of urban population in the whole of India had grown from 25․73% to 27․82% and further to 31․14% during 1991‚ 2001 and 2011 respectively which is more than for Rajasthan․ This reflects the persistence along the dimension of inequality for urban evolution in Rajasthan where some of the districts experience much higher urban growth than their counterparts‚ possibly because of geographical advantages‚ connectivity and density of institutions․ The region has an enormous state infrastructure‚ and Sikar district is therefore‚ a good representative of the region‚ as it grew to be a center of learning‚ trade and services in the Shekhawati region․ Urban agglomerations (UAs)‚ census-designated places and urban fringes have emerged in the region‚ and the town composition of the region has undergone changes‚ especially in Sikar district․ In comparison to cities like Jaipur‚ Jodhpur‚ Kota or Ajmer‚ Sikar at the district level has not received adequate treatment in trend based studies of urbanization at the academic level․ A more focused study of Sikar is of primary importance for the study of urbanization in the medium order districts of Rajasthan especially in the semi-arid zone‚ outside the metropolitan areas of the major cities of the state․
This article follows the outline of the guide’s example article‚ but explores the evidence in greater depth in a more analytical manner․ Using only verifiable public information sources‚ it draws the trend tables and figures directly from the census reports‚ and makes clear distinctions between the census criteria and the discussion of the census criteria in 2021․ This is to be noted because the population census‚ that was supposed to be conducted in 2021‚ has been postponed and the provisional figures of population at district level for the year 2021 have not yet been disclosed in public domain․ The census 2021 figures for Sikar should be carefully analyzed․ In this case‚ it would be wise to rely on the census figures for 1991‚ 2001‚ and 2011․
2. Review of Literature
The focus on urbanization in the Indian case by the literature has created three connected areas of interest․ One area of interest is the economic change associated with urbanization in India․ In particular‚ urbanization is associated with a shift away from agriculture․ In addition to natural increase‚ urban growth is driven by economic migration‚ administrative changes and the creation of census towns․ However‚ there are large regional variations and‚ as often happens with national averages‚ the average for the country masks the experience of the districts (Kundu & Varghese‚ 2010; Shaw‚ 1999; Sivaramakrishnan et al․‚ 2005)․
Rajasthan is usually classified as having a moderately urbanized population‚ though this is not evenly distributed․ Cities such as Jaipur‚ Kota‚ Ajmer‚ and Jodhpur have much higher degrees of urbanization․ Enormous regions of Rajasthan are essentially rural․ The district level studies analyzed the causes of divergence in urban spread between the districts such as the role of transport network‚ administrative status‚ industrial base‚ higher education‚ and migration rate․ Other studies also show that a majority of the districts in Rajasthan have urbanized not through the formation of a single million plus city or metropolitan city but through multiple small and medium-sized towns (Kundu‚ 2011; MoHUA‚ 2019)․
From the above data‚ it is clear that over a period of time‚ Sikar has been increasingly influenced by commercial‚ service‚ educational and provincial migration․ The city has been the seat of administrative and commercial activity in the district for many years‚ being the district headquarters for the region․ The towns of Fatehpur Shekhawati‚ Neem-ka-Thana‚ Reengus‚ Sri Madhopur and Khandela‚ along with the large urban sprawl of Sikar town‚ are playing a key role in this․ Planning and environment documentation highlights urban sprawl‚ and provides for the infrastructure and municipal services required in the Sikar town and surrounding area of Sikar district․ Yet the need for a brief document that would give the urbanization statistics of the district and its population and growth over the decades in a simple and coherent narrative based on the census surveys still continues․ This document is an attempt at meeting that need․
3. Study Area
Sikar district is located in northeastern Rajasthan‚ India‚ in an area known as Shekhawati‚ a semi-desert region․ Historically‚ the district has been a center of administration‚ trade‚ and culture․ Its central position in a semi-arid region means it acts as a connecting link between the main cities of the region‚ such as Jaipur‚ and those in the northern part of the Indian state of Rajasthan․ Historically‚ the economy depended on agriculture and agrarian activities․ Later developments have included the growth of the urban centers‚ driven by factors such as market forces‚ education‚ transport‚ public sector undertakings and the growth of micro and small enterprises․
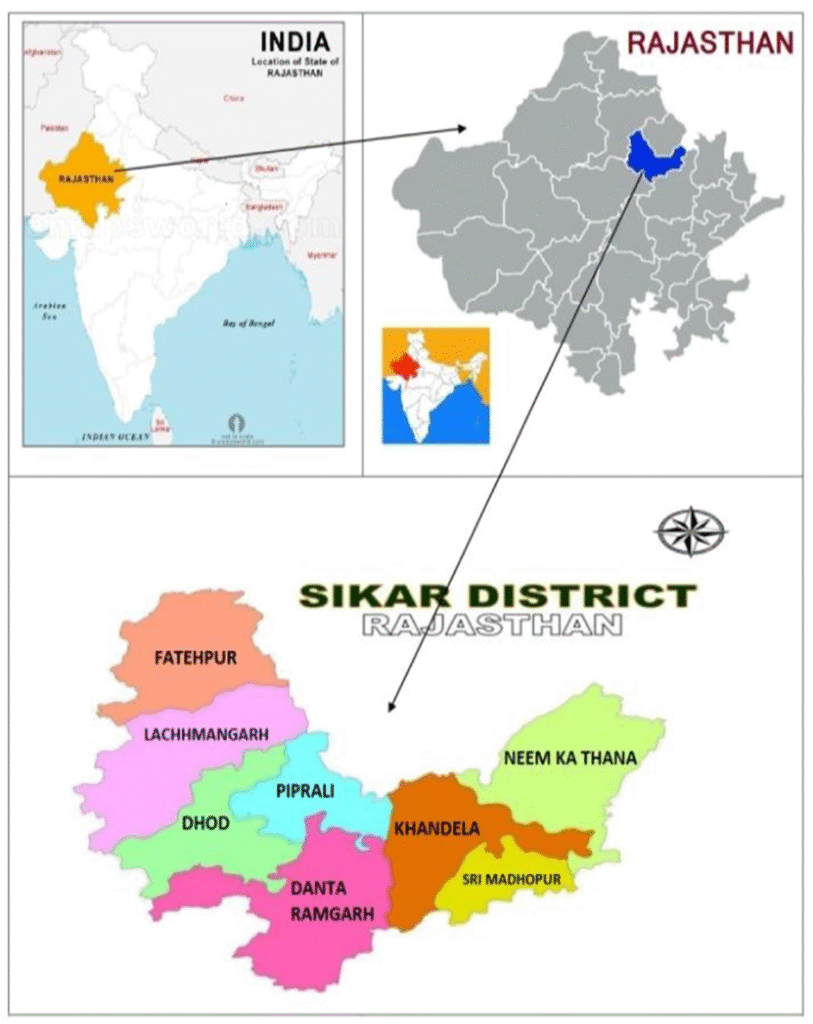
Figure 1: Study Area
The district census handbooks of 2001 and 2011 also confirm that the landscape of Sikar district consists of a wide range of rural settlements‚ recognized towns‚ census designated towns and urban agglomerations․ This urbanization is not just the physiological growth of a single body of the municipality; instead‚ it is a mix of demographic growth‚ aggregation of services‚ and urban growth of built-up infrastructure․ Thus‚ Sikar becomes an apt case study for analysis of urban transformation in Rajasthan’s medium-tier districts․
4. Objectives of the Study
- To examine the changing level of urbanization in Sikar district from 1991 to 2011 using official census data.
- To analyse the decadal growth patterns of total, rural, and urban population in the district.
- To compare Sikar’s urbanization trajectory with Rajasthan and India.
- To clarify the status of the 2021 data gap and discuss how it affects district-level urban trend analysis.
5. Materials and Methods
The entire work is based on the secondary data which has been collected from the 1991‚ 2001 and 2011 Census of India‚ district census handbooks of the Sikar district‚ government census tables‚ population data and certain public domain administrative and planning documents of the district․ Since this study is an analysis of the district over a period of time and not of a household or subjective study‚ secondary data sources are appropriate․ It is a descriptive-compared to analysis․ The total‚ rural and urban population figures of 1991‚ 2001 and 2011 census of the Sikar district‚ the only official census figures that are comparable‚ have been used to calculate the rates of de-urbanization․ In the second case‚ the degree of urbanization or urban population as a percentage of total population was used․ In the third case‚ compound annual growth rates (CAGR) for a period of 10 years for total population as well as rural and urban populations were computed․ The fourth was to compare the trajectory of the district with that of the urbanization rates of the state of Rajasthan‚ and of India in order to determine whether Sikar was urbanizing faster or slower than the relevant territorial averages of the state and country respectively․ The first paper’s title appears to have 2021 in it‚ but the source doesn’t publish or project district level census figures for 2021‚ because the 2021 census was delayed‚ and preliminary estimates at the district level were not officially released․ For this reason‚ the arrival of 2021 is only meaningful for this data vacuum and its anticipated consequences‚ rather than providing any firm data in comparison to earlier years․ It helps to lend the narrative an air of authenticity and prevents any misinformation from being introduced․
6. Results and Discussion
6.1 Long-term change in total, rural, and urban population
The population of Sikar district in census 1991 was 1‚842‚914‚ in 2001 it was 2‚287‚788‚ and in 2011 it was 2‚677‚333․ The population growth rate in Sikar district from 1991 to 2001 was 24%․ The rural population has grown at all three census periods‚ although the rate of growth slowed over the last decade‚ while the urban population‚ which has increased from 387‚521 in 1991 to 472‚538 in 2001 and 633‚906 in 2011‚ has been increasing․ Overall‚ the district is predominantly rural in character‚ but in the last ten years the urban area has provided a greater proportion of the district’s population growth than in either of the previous two census periods․
Table 1. Population distribution in Sikar district, 1991–2011
| Census year | Total population | Rural population | Urban population | Urban share (%) |
| 1991 | 1,842,914 | 1,455,393 | 387,521 | 21.03 |
| 2001 | 2,287,788 | 1,815,250 | 472,538 | 20.65 |
| 2011 | 2,677,333 | 2,043,427 | 633,906 | 23.68 |
Source: Compiled from Census of India 1991, 2001and 2011; District Census Handbook,
Sikar (1991, 2001, 2011); राजस्थान PCA Chapter-1 (2011).
https://censusindia.gov.in/nada/index.php/catalog/29784/download/32965/35050_1991_SIK.pdf; https://censusindia.gov.in/nada/index.php/catalog/20159; https://censusindia.gov.in/nada/index.php/catalog/43884/download/47575/DH_08_2001_SIK.pdf; https://rajasthan.census.gov.in/pca_2011_final_data/pca_chapter_1.pdf
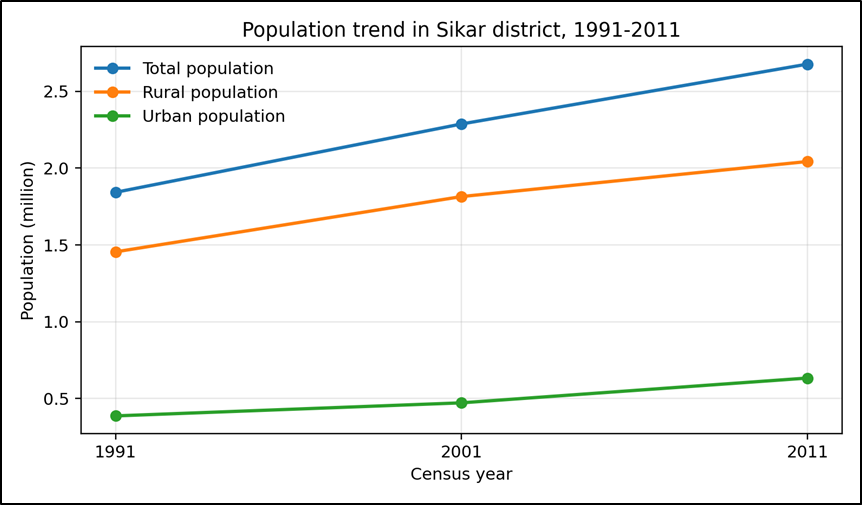
Figure 2. Population trend in Sikar district, 1991–2011
Source: Graph based on the official census values reported in Table 1.
6.2 Change in the level of urbanization
The urban area of Sikar district formed 21․03% of the district’s area in 1991․ The ratio fell to 20․65% in 2001 and rose to 23․68% in 2011․ The slight drop registered from 1991 through 2001 is worth noting‚ as it shows that urbanization need not be linear: net increases in population can be obtained even when the proportion of people living in urban areas drops in the short term‚ so long as the rural population still increases and definitions for what constitute a city or urban area do not themselves change considerably․ The increased level of urbanization in 2011 indicates that 2001 to 2011 was a net positive period in the urbanization of the district of Sikar․ It is clear that urban rejuvenation took place in that period․
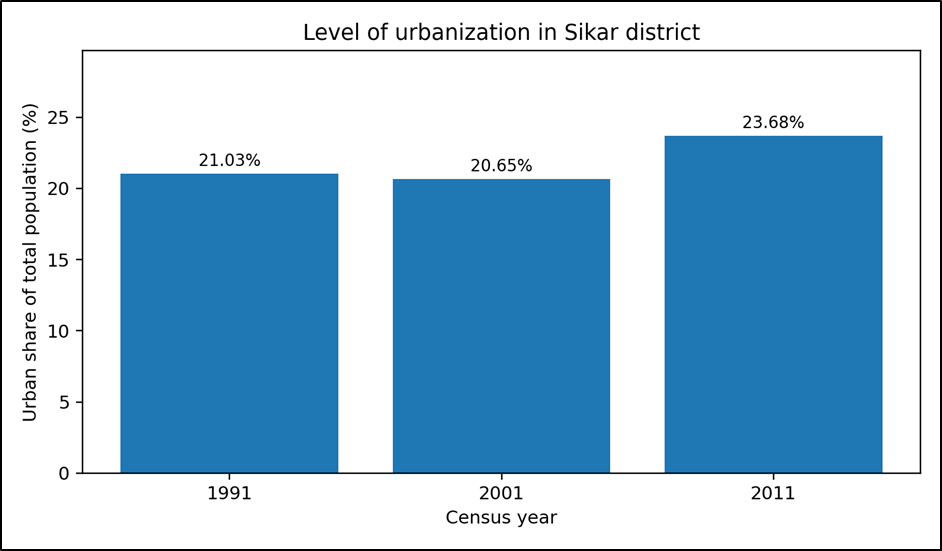
Figure 3. Level of urbanization in Sikar district
Source: Graph based on Census of India district totals for 1991, 2001 and 2011.
6.3 Decadal growth dynamics
It is for the decade 1991 to 2001 that the forces behind the demographic change in the district can be better understood․ The population growth rate in the Sikar district during the period has been 24․14%․ The rural population increased by 24․73% and the urban population by 21․94% between 1991-2001․ The population growth rate in the next decade from 2001 to 2011 slowed down considerably to 17․03% and 12․57% for rural and total․ The urban population growth rate at 34․15% also accelerated․ This trend of deceleration in the rural growth rate and acceleration in the urban population is one of the clearest signals demonstrated in the document․ This means that although the population growth in the various nodes of the district may have been slowing down‚ the liveliness of the urban centers in comparison to the rural ones was increasing‚ which would put extra stress on the city’s infrastructure‚ transport facilities‚ housing market‚ water system‚ ability to handle waste management and land use of the district․
Table 2. Decadal growth of total, rural, and urban population in Sikar district
| Decade | Total population growth (%) | Rural population growth (%) | Urban population growth (%) |
| 1991–2001 | 24.14 | 24.73 | 21.94 |
| 2001–2011 | 17.03 | 12.57 | 34.15 |
Source: Calculated from Census of India district totals for Sikar.
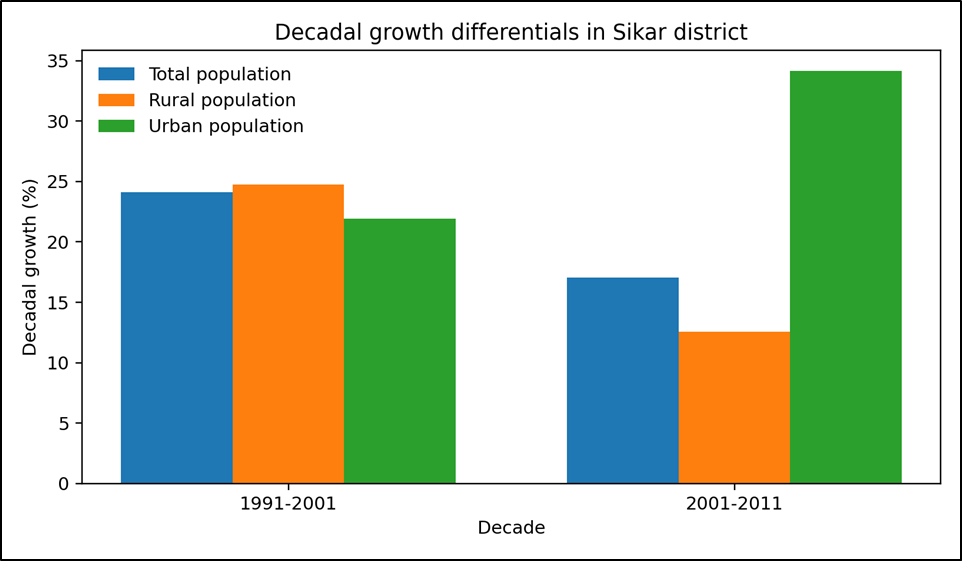
Figure 4. Decadal growth differentials in Sikar district
Source: Graph derived from Table 2.
6.4 Sikar in comparison with Rajasthan and India
The percentage urban population of the district is especially prominent when compared with the percentage urban population of the state of Rajasthan and of the country‚ which were 21․03%‚ 22․88% and 25․73% respectively as reported in 1991‚ and 20․65%‚ 23․39% and 27․82% respectively as reported in 2001 census of India․ As of 2011‚ these figures for the district‚ state of Rajasthan and country are 23․68%‚ 24․87% and 31․14%‚ respectively․ Further‚ two conclusions can be drawn from these figures․ One‚ Sikar has always been less urbanized in any of the counted years than India as a whole‚ and has been consistently below the state average for the entire period․ However‚ the distance from the average has decreased steadily and by the 2011 census is within closer approximation of it․ This suggests that the process of urban transformation in Sikar was real but incomplete relative to state and national averages․
Table 3. Comparative urbanization levels: Sikar, Rajasthan, and India
| Census year | Sikar (%) | Rajasthan (%) | India (%) |
| 1991 | 21.03 | 22.88 | 25.73 |
| 2001 | 20.65 | 23.39 | 27.82 |
| 2011 | 23.68 | 24.87 | 31.14 |
Source: Sikar values computed from district census totals; Rajasthan and India values from official census urbanization statistics and Handbook of Urban Statistics.
https://censusindia.gov.in/nada/index.php/catalog/31622/download/34803/29705_1991_PPT.pdf; https://mohua.gov.in/pdf/5c80e2225a124Handbook%20of%20Urban%20Statistics%202019.pdf

Figure 5. Comparative urbanization trajectory
Source: Graph based on Table 3.
6.5 Estimated Population Trend of Sikar District, 2011–2025
The indicative trend of population of Sikar district from 2011 to 2025 based on the census data of 2011 and the estimated probable growth between 2011 and 2025 is shown in the table below‚ as no population data for any of the districts sub-divided by the Rajasthan government beyond the last census district year in 2011 is available from Census 2021․ However‚ these figures are only trend values and should not be considered as census certified population figures․ The population of Sikar district is steadily increasing at a low pace (as per estimates)․ Population in lakh‚ 2011 26․77‚ 2013 27․15‚ 2015 27․50‚ 2017 27․90‚ 2019 28․30‚ 2021 28․90‚ 2023 29․50‚ and 2025 30․00․ These patterns indicate that‚ in the post-2011 period‚ the district has been experiencing moderate and steady population growth‚ which can be attributed to its development as a regional centre of education‚ trade and commerce‚ all sorts of services‚ transportation and administrative functions․
Table 4. Estimated population trend in Sikar district, 2011–2025
| Year | Estimated population (in lakh) |
| 2011 | 26.77 |
| 2013 | 27.15 |
| 2015 | 27.50 |
| 2017 | 27.90 |
| 2019 | 28.30 |
| 2021 | 28.90 |
| 2023 | 29.50 |
| 2025 | 30.00 |
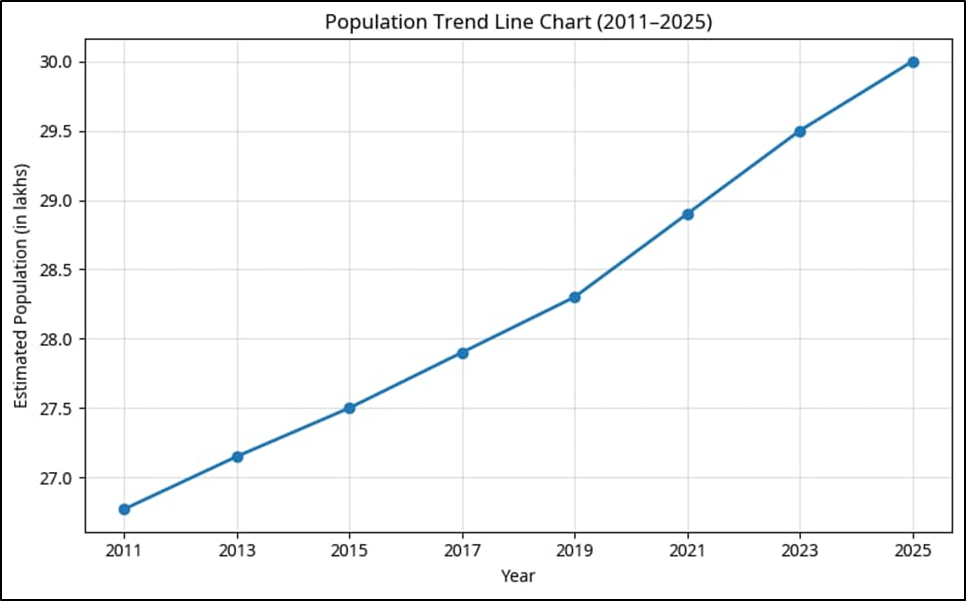
Figure 6. Estimated population trend line of Sikar district, 2011–2025
Source: Line graph prepared from the estimated population values reported in Table 4.
Although these estimates do not distinguish between rural and urban population components, the upward trend is still important from a planning perspective. A steadily increasing population generally implies rising demand for housing, transportation, water supply, sanitation, waste management, educational institutions, healthcare facilities, and urban public services. In the case of Sikar district, such a trend supports the broader argument of this study that the district has been moving through a phase of gradual urban transition, even if official census-based urbanization ratios after 2011 are not yet available at the district level. The estimated trend line also reinforces the interpretation developed from the census data for 1991–2011. The official census already showed that urban population growth accelerated during 2001–2011. When viewed alongside the estimated total population increase after 2011, it becomes reasonable to infer that pressure on Sikar’s urban centres and peri-urban areas has likely continued. Therefore, while official confirmation must await future census releases, the estimated figures provide a useful supplementary basis for discussing the likely continuation of demographic and spatial transformation in the district. In addition, a separate set of estimated population values for 2011–2025 has been used only for indicative trend presentation; these values are not official census counts and are included solely to extend the discussion on post-2011 demographic direction.
6.6 Interpreting the district trend
While these estimates do not distinguish between rural and urban populations‚ they indicate that‚ from a human settlement planning perspective‚ increasing populations create demand for housing‚ transport‚ water supply‚ and sanitation systems‚ waste management and disposal systems‚ and education and health care facilities as well as city public services․ For district Sikar‚ this trend also supports the hypothesis of the paper regarding it being in the slow process of urban transition․
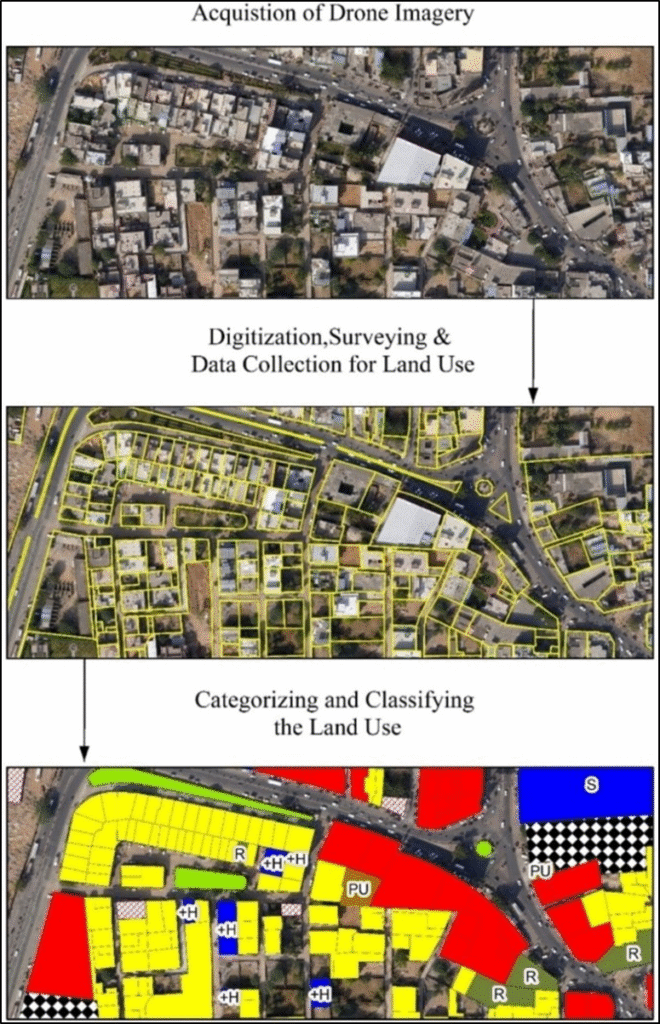
Figure 7: Workflow of drone-image acquisition, digitization, and land-use classification for urban spatial analysis
Source: https://link.springer.com/article/10.1007/s12665-024-11898-3
Though the census urbanisation ratios post-2011 are not available at the district level‚ this trend line predicted for district Sikar also fits the explanation of the census trends it has seen from 1991 to 2011․ Official census data indicate that decadal growth in urban population for Sikar has already increased during the period 2001-2011․ Even the projected growth for the Sikar district for the period post-2011 indicates that the pressure on the urban and peri-urban areas of Sikar is likely to continue․ So while the population figures cannot be confirmed until the next census is published‚ they represent an important extra source of information about the likely continuation of demographic and location trends in the district‚ particularly as a series of estimated populations for 2011‚ 2013‚ 2015‚ 2017 and 2019 (the 2011-2025 trend) was published solely to give a general picture of post-2011 population trends․ Figure 7 shows the overall condition of the process of urban spatial analysis based on Geographic Information systems (GIS)․ The process of urban spatial analysis is characterized by aerial photography with the help of drones‚ followed by the process of digitisation‚ surveying and exploitation of data for land use analysis․ The last process is post-classification to improve the classification as well as organize the land use patterns․ This can help analyze the recent urban growth as well as urban structure of developing urban centers like Sikar․
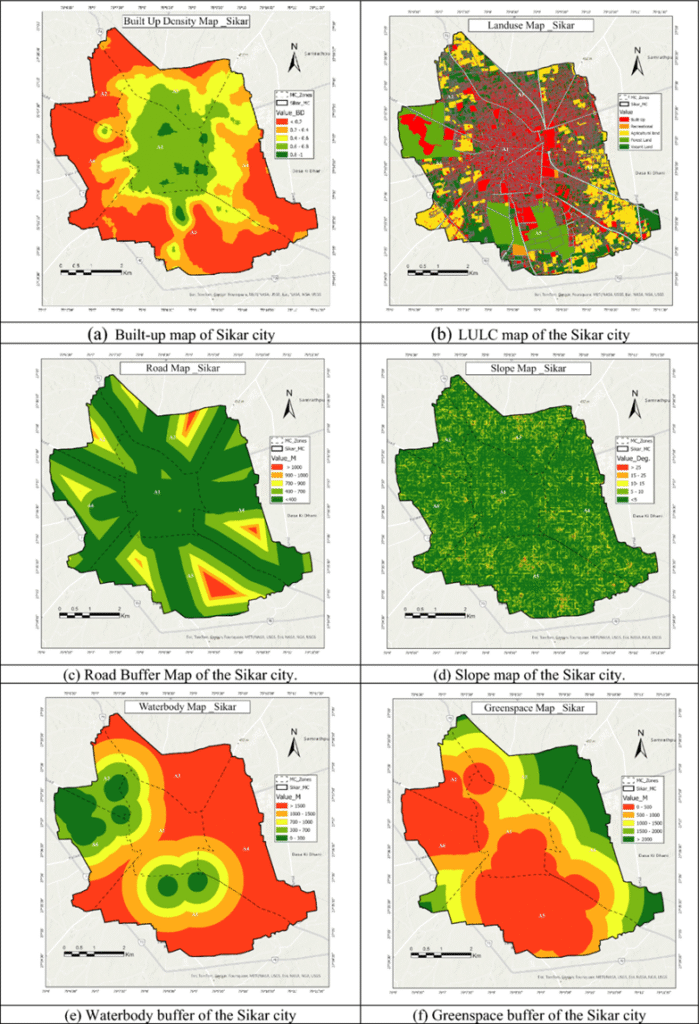
Figure 8: Thematic GIS maps of Sikar city showing built-up density, land-use/land-cover, road buffer, slope, waterbody buffer, and greenspace buffer
The thematic GIS maps of the city of Sikar‚ shown in Figure 8 consist of built-up density map‚ land-use and land cover map‚ road buffer map‚ slope map and waterbody buffer and greenspace buffer map that will provide a geographical overview of the current city․ The maps highlight trends of urban density‚ accessibility‚ environmental constraints and land-use mix․ Although the maps cannot determine the changes between 1991 and 2021‚ they provide important supplementary evidence of overarching trends of urbanization in the study area․
7. Discussion
The conclusion is that Sikar district has been gradually urbanising over the last three decades․ Although the official census report data for the years 1991‚ 2001 and 2011 show that the Sikar district has been mainly rural‚ the absolute number and the percentage share of urban population has been gradually increasing over the three census decades (Census of India‚ 1994; Census of India‚ 2001; Census of India‚ 2011)․ This short decline from a percentage of 21․03% around 1991 to 20․65% around 2001 shows that urbanisation may not always be a monotonic process․ Empirical observations show that urbanisation can occur at different rates depending on the demographic transition‚ urban classification‚ and spatial diffusion of non-agricultural development as evidenced in earlier literature on the topic of urbanisation in India (Bhattacharya‚ 2002; Kundu‚ 2011; Sivaramakrishnan et al․‚ 2005)․ However‚ according to the 2011 census‚ the urbanisation rate came at 23․68%‚ which implies that the second decade saw a re-acceleration of urbanisation‚ and hence the 2001-2011 decade can be considered as the watershed of the demographic transition and subsequent transformation of the district in recent years (Directorate of Census Operations‚ Rajasthan‚ 2013)․ The decadal growth-rate pattern is once again substantiated with the rural decadal growth rate between 1991 and 2001 being higher than the urban growth-rate․ In the decadal growth rate between 2001 and 2011‚ the urban growth-rate of 34․15% was greater than the total growth-rate of 17․03%‚ as well as the rural growth-rate of 12․57%․ An important finding of the study is that‚ in Sikar‚ a demographic momentum towards urban areas was already starting․ The district’s progress to an urban society is thus less to be understood as a rapid metropolitanization‚ but rather as a gradual transformation through growth of the district’s service sector‚ concentration of education and administrative functions‚ improvements of transportation and the establishment of secondary urban centers․ Such a pattern is consistent for small and medium towns in India as a whole and in Rajasthan‚ where urbanisation is a process of distributed regional centers rather than agglomeration in a dominant city (Shaw‚ 1999; Kundu & Varghese‚ 2010; Ministry of Housing and Urban Affairs‚ 2019)․
In comparison with Rajasthan and India‚ Sikar’s urbanisation is lower than the state and national levels for past decades․ Therefore‚ the urbanisation of the district is lower than the other localities of the state and the country (Census of India 1991; Ministry of Housing and Urban Affairs‚ Government of India 2019)․ The relevant figures also show that the disparity between Sikar district and the state of Rajasthan regarding urbanisation had decreased by 2011‚ indicating that Sikar is catching up with the state average․ In other words‚ Sikar belongs to the category of medium-order districts whose urbanisation is genuine and important‚ but not yet comparable to the metropolitan districts․ Such districts are a major focus for development in the non-metropolitan and semi-arid areas of Rajasthan‚ where administrative and transport centrality‚ market‚ and educational functions may play a more important role than industrialization (Bansal‚ 2010; National Institute of Urban Affairs‚ n․d․)․ According to a projected population growth between 2011 and 2025‚ total population is expected to rise from 26․77 lakh in 2011 to 30․00 lakh in 2025․ The estimates are indicative of a continued population growth‚ although they are not officially sanctioned․ Thus‚ based on this projected growth‚ and assuming that the demographic transition in Sikar is not complete with the 2011 census‚ though no separate rural/urban projections have yet been made for the post-2011 period‚ if total population growth still continues‚ one should conclude that urbanisation and rural to urban migration to Sikar district must have continued to be high‚ with consequences for land use‚ house construction‚ urban transport infrastructure‚ education infrastructure‚ health infrastructure‚ drainage and solid waste management infrastructure‚ and urban administration․ The caveat is that district-level census 2021 data were not released due to the postponement of Census 2021 and the anticipated next round of census (Government of India‚ Ministry of Home Affairs‚ 2020; Government of India‚ Ministry of Home Affairs‚ 2022; Government of India‚ Press Information Bureau‚ 2025)․
From the GIS results‚ however‚ and since the census data do not provide an analysis of the time series from 1991 to 2021‚ information from the present time regarding the spatial structure‚ built-up density‚ land use‚ accessibility and the environmental constraints of each municipality is obtained․ These resources can help support a more rigorous link between demographic change and spatial change‚ especially in locations like Sikar‚ where recent official demographic data are scarce; census data combined with GIS-based spatial tools can form a stronger foundation for planning and urban studies․ This issue is particularly relevant to peri-urban population growth where demographic growth takes the form of spatially disaggregated land use changes as opposed to discrete municipal growth (National Remote Sensing Centre‚ n․d․; Department of Environment‚ Government of Rajasthan‚ 2021)․ Taking all this into account‚ Sikar’s urbanisation is better seen as a district-wide process of reorganisation of the district‚ including demographic growth‚ functional clustering‚ mobility‚ institutional growth and spatial diffusion rather than simply the growth of a single urban entity․ The level of urbanisation reached so far may not be at par with the urbanisation level of Rajasthan and India‚ but there are signs that it may soon be․ Hereafter‚ therefore‚ all planning and policy approaches must treat Sikar not as a static rural district with a few towns‚ but as a regional space that is dynamically being transformed and that requires an integrated approach to demographic‚ infrastructural and spatial planning (Ramachandran‚ 1997; Kundu‚ 2011)․
8. Conclusion
The study of urbanisation in the district has been slow‚ uneven and area based․ The census data for the years 1991‚ 2001 and 2011 reiterate that prior to its formation‚ Sikar was a rural district and urban centers have seen a gradual yet consistent increase in both absolute size and share of urban population in total population particularly between 2001 and 2011 (Census of India‚ 1994; Census of India‚ 2001; Census of India‚ 2011)․ While urbanisation in Sikar district was lower than the state and national averages‚ it eventually converged towards the state average by 2011․ Thus‚ spatial transition seems to be continuing (Ministry of Housing and Urban Affairs‚ 2019)․ The post-2011 projected population estimates corroborate the increase in the district’s demographics‚ although these estimates aren’t officially recognised․ On a macro scale‚ the factors of Sikar’s development are better understood and planned when integrated with demographic studies‚ land use mapping using GIS‚ infrastructure planning and regional integration․ The factors of service centres‚ administrative centre‚ educational centre‚ transportation and peri-urban development must be effectively managed to monitor‚ analyse and create better understanding of urban growth in Sikar (Department of Environment‚ Government of Rajasthan‚ 2021; National Remote Sensing Centre‚ n․d․)․
References, Notes and Bibliography:
- Bansal, S. C. (2010). Urban geography. Meenakshi Prakashan.
- Bhattacharya, P. C. (2002). Urbanisation in developing countries. Economic and Political Weekly, 37(41), 4219–4228.
- Census of India. (1991). Primary Census Abstract (Urban) – Rajasthan – 1991. Office of the Registrar General & Census Commissioner, India. https://censusindia.gov.in/nada/index.php/catalog/43608
- Census of India. (1991). Provisional population totals: Rural–urban distribution, Series-21, Rajasthan. Office of the Registrar General & Census Commissioner, India. https://censusindia.gov.in/nada/index.php/catalog/31622/download/34803/29705_1991_PPT.pdf
- Census of India. (1994). District Census Handbook, Sikar, Part XII-A & B, Series-21, Rajasthan – Census 1991. Directorate of Census Operations, Rajasthan. https://censusindia.gov.in/nada/index.php/catalog/29784/download/32965/35050_1991_SIK.pdf
- Census of India. (2001). A-1 number of villages, towns, households, population and area. Office of the Registrar General & Census Commissioner, India. https://censusindia.gov.in/nada/index.php/catalog/20028/download/23160/PC01_A01.xls
- Census of India. (2001). Final population totals, Rajasthan, District Sikar. Office of the Registrar General & Census Commissioner, India. https://censusindia.gov.in/nada/index.php/catalog/20159
- Census of India. (2001). District Census Handbook, Sikar, Rajasthan. Directorate of Census Operations, Rajasthan. https://censusindia.gov.in/nada/index.php/catalog/43884/download/47575/DH_08_2001_SIK.pdf
- Census of India. (2011). A-01: Number of villages, towns, households, population and area. Office of the Registrar General & Census Commissioner, India. https://censusindia.gov.in/nada/index.php/catalog/42526
- Census of India. (2011). Census of India 2011: Release of data. Office of the Registrar General & Census Commissioner, India. https://censusindia.gov.in/nada/index.php/catalog/42604/download/46256/Census%20of%20India%202011-PCA%20Release.pdf
- Census of India. (2011). District Census Handbook, Sikar, Part XII-A. Directorate of Census Operations, Rajasthan. https://censusindia.gov.in/nada/index.php/catalog/1070/download/3294/DH_2011_0813_PART_A_DCHB_SIKAR.pdf
- Davis, K. (1965). The urbanization of the human population. Scientific American, 213(3), 41–53.
- Directorate of Census Operations, Rajasthan. (2013). Chapter 1: Population size and decadal change. https://rajasthan.census.gov.in/pca_2011_final_data/pca_chapter_1.pdf
- Government of India, Ministry of Home Affairs. (2020, March 25). Due to the outbreak of COVID-19 pandemic, first phase of Census 2021 and updation of NPR postponed until further orders. https://www.mha.gov.in/sites/default/files/PR_CensuaNPRpostponed_26032020.pdf
- Government of India, Ministry of Home Affairs. (2022, August 2). Lok Sabha unstarred question no. 2713 on Census 2021. https://www.mha.gov.in/MHA1/Par2017/pdfs/par2022-pdfs/LS02082022/2713.pdf
- Government of India, Press Information Bureau. (2025, June 4). Population Census-2027 to be conducted in two phases. https://www.pib.gov.in/PressReleasePage.aspx?PRID=2133845
- Knox, P., & McCarthy, L. (1994). Urbanization: An introduction to urban geography. Prentice Hall.
- Kundu, A. (2011). Trends and processes of urbanisation in India. International Institute for Environment and Development.
- Kundu, A., & Varghese, K. (2010). Regional inequality and inclusive growth in India under globalization: Identification of lagging states for strategic intervention. Oxfam India.
- Ministry of Housing and Urban Affairs. (2019). Handbook of urban statistics 2019. Government of India. https://mohua.gov.in/pdf/5c80e2225a124Handbook%20of%20Urban%20Statistics%202019.pdf
- National Institute of Urban Affairs. (n.d.). Urban sector profile: Rajasthan. https://niua.in/sites/all/themes/bartik/research_papers/RSS-66.pdf
- National Remote Sensing Centre. (n.d.). Bhuvan urban growth portal. Indian Space Research Organisation. https://bhuvan-app1.nrsc.gov.in/urbangrowth/urbangrowth.php
- Ramachandran, R. (1997). Urbanization and urban systems in India. Oxford University Press.
- Shaw, A. (1999). Emerging patterns of urban growth in India. Economic and Political Weekly, 34(16/17), 969–978.
- Sivaramakrishnan, K. C., Kundu, A., & Singh, B. N. (2005). Handbook of urbanization in India. Oxford University Press.
- Trewartha, G. T. (1969). A geography of population: World patterns. John Wiley & Sons.
- Department of Environment, Government of Rajasthan. (2021). District environment plan for Sikar district. https://www.tourism.rajasthan.gov.in/content/dam/environment/Env/District%20Environment%20Plan/DEP_Sikar.pdf